Canadian vs Thai Poverty
COMPARE
Canadian
Thai
Poverty
Poverty Comparison
Canadians
Thais
11.6%
POVERTY
91.7/ 100
METRIC RATING
108th/ 347
METRIC RANK
9.6%
POVERTY
100.0/ 100
METRIC RATING
3rd/ 347
METRIC RANK
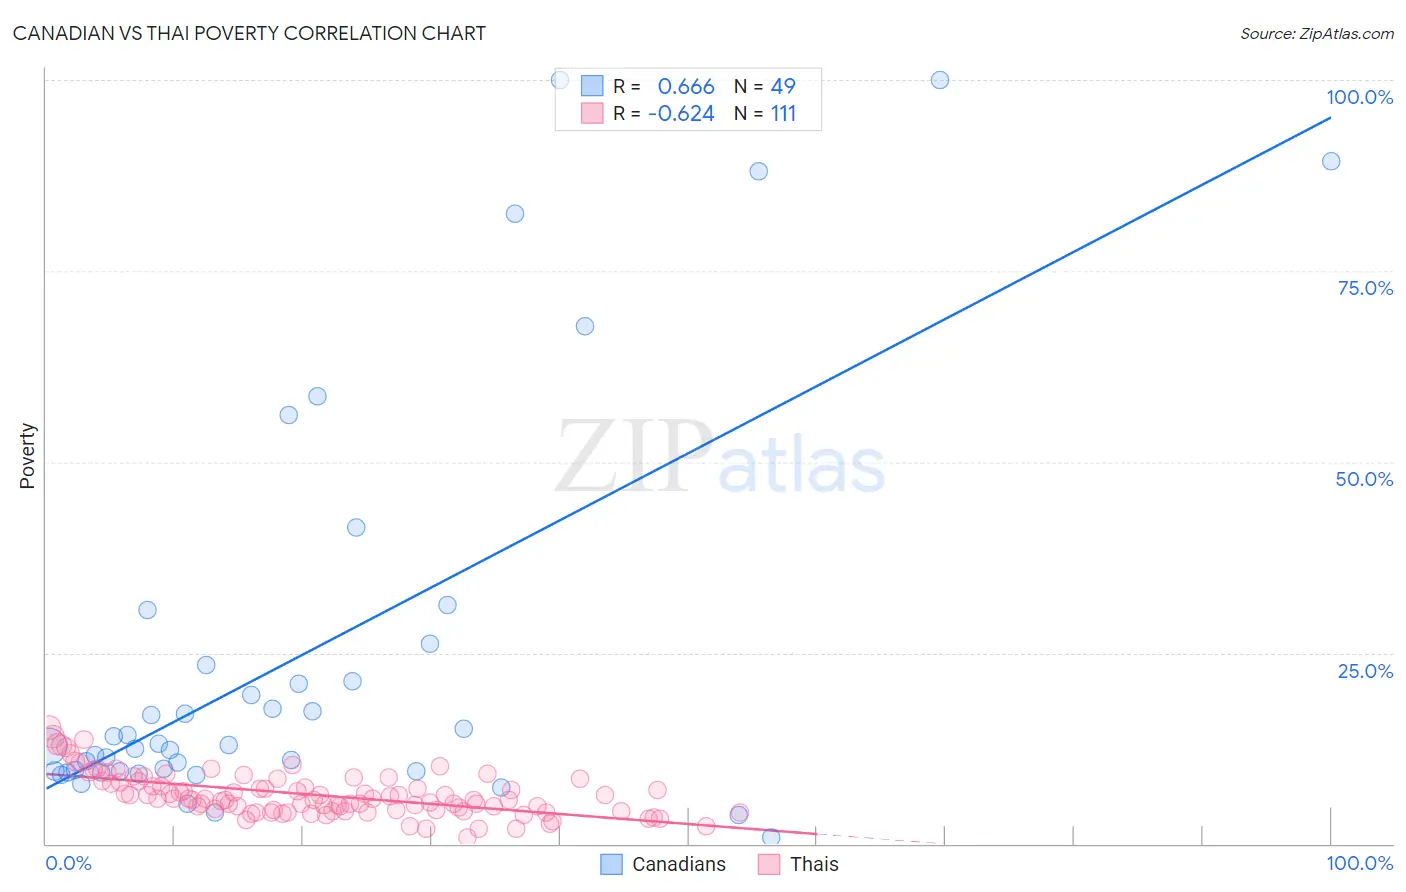
Canadian vs Thai Poverty Correlation Chart
The statistical analysis conducted on geographies consisting of 437,267,271 people shows a significant positive correlation between the proportion of Canadians and poverty level in the United States with a correlation coefficient (R) of 0.666 and weighted average of 11.6%. Similarly, the statistical analysis conducted on geographies consisting of 475,359,264 people shows a significant negative correlation between the proportion of Thais and poverty level in the United States with a correlation coefficient (R) of -0.624 and weighted average of 9.6%, a difference of 21.0%.
Poverty Correlation Summary
| Measurement | Canadian | Thai |
| Minimum | 0.75% | 0.80% |
| Maximum | 100.0% | 15.1% |
| Range | 99.2% | 14.4% |
| Mean | 24.7% | 6.4% |
| Median | 12.9% | 5.9% |
| Interquartile 25% (IQ1) | 9.5% | 4.4% |
| Interquartile 75% (IQ3) | 24.8% | 8.2% |
| Interquartile Range (IQR) | 15.3% | 3.9% |
| Standard Deviation (Sample) | 26.7% | 2.8% |
| Standard Deviation (Population) | 26.4% | 2.8% |
Similar Demographics by Poverty
Demographics Similar to Canadians by Poverty
In terms of poverty, the demographic groups most similar to Canadians are Immigrants from Turkey (11.6%, a difference of 0.010%), Palestinian (11.6%, a difference of 0.030%), Welsh (11.6%, a difference of 0.060%), Immigrants from Zimbabwe (11.6%, a difference of 0.12%), and Portuguese (11.6%, a difference of 0.13%).
| Demographics | Rating | Rank | Poverty |
| Slavs | 93.3 /100 | #101 | Exceptional 11.5% |
| Laotians | 92.4 /100 | #102 | Exceptional 11.6% |
| Okinawans | 92.4 /100 | #103 | Exceptional 11.6% |
| Native Hawaiians | 92.1 /100 | #104 | Exceptional 11.6% |
| Portuguese | 92.1 /100 | #105 | Exceptional 11.6% |
| Immigrants | Zimbabwe | 92.1 /100 | #106 | Exceptional 11.6% |
| Palestinians | 91.8 /100 | #107 | Exceptional 11.6% |
| Canadians | 91.7 /100 | #108 | Exceptional 11.6% |
| Immigrants | Turkey | 91.7 /100 | #109 | Exceptional 11.6% |
| Welsh | 91.6 /100 | #110 | Exceptional 11.6% |
| French Canadians | 91.0 /100 | #111 | Exceptional 11.6% |
| Immigrants | Southern Europe | 90.8 /100 | #112 | Exceptional 11.6% |
| Immigrants | Belarus | 90.8 /100 | #113 | Exceptional 11.6% |
| Immigrants | China | 90.7 /100 | #114 | Exceptional 11.6% |
| Albanians | 90.3 /100 | #115 | Exceptional 11.7% |
Demographics Similar to Thais by Poverty
In terms of poverty, the demographic groups most similar to Thais are Chinese (9.5%, a difference of 0.45%), Immigrants from Taiwan (9.7%, a difference of 1.5%), Immigrants from Ireland (10.1%, a difference of 5.2%), Assyrian/Chaldean/Syriac (10.1%, a difference of 5.3%), and Filipino (10.1%, a difference of 5.5%).
| Demographics | Rating | Rank | Poverty |
| Immigrants | India | 100.0 /100 | #1 | Exceptional 9.0% |
| Chinese | 100.0 /100 | #2 | Exceptional 9.5% |
| Thais | 100.0 /100 | #3 | Exceptional 9.6% |
| Immigrants | Taiwan | 100.0 /100 | #4 | Exceptional 9.7% |
| Immigrants | Ireland | 99.9 /100 | #5 | Exceptional 10.1% |
| Assyrians/Chaldeans/Syriacs | 99.9 /100 | #6 | Exceptional 10.1% |
| Filipinos | 99.9 /100 | #7 | Exceptional 10.1% |
| Maltese | 99.9 /100 | #8 | Exceptional 10.2% |
| Immigrants | South Central Asia | 99.9 /100 | #9 | Exceptional 10.2% |
| Bulgarians | 99.9 /100 | #10 | Exceptional 10.2% |
| Immigrants | Lithuania | 99.9 /100 | #11 | Exceptional 10.3% |
| Bhutanese | 99.8 /100 | #12 | Exceptional 10.4% |
| Immigrants | Hong Kong | 99.8 /100 | #13 | Exceptional 10.4% |
| Immigrants | Bolivia | 99.8 /100 | #14 | Exceptional 10.4% |
| Bolivians | 99.8 /100 | #15 | Exceptional 10.4% |