Immigrants from Caribbean vs Menominee Poverty
COMPARE
Immigrants from Caribbean
Menominee
Poverty
Poverty Comparison
Immigrants from Caribbean
Menominee
15.5%
POVERTY
0.0/ 100
METRIC RATING
303rd/ 347
METRIC RANK
16.4%
POVERTY
0.0/ 100
METRIC RATING
322nd/ 347
METRIC RANK
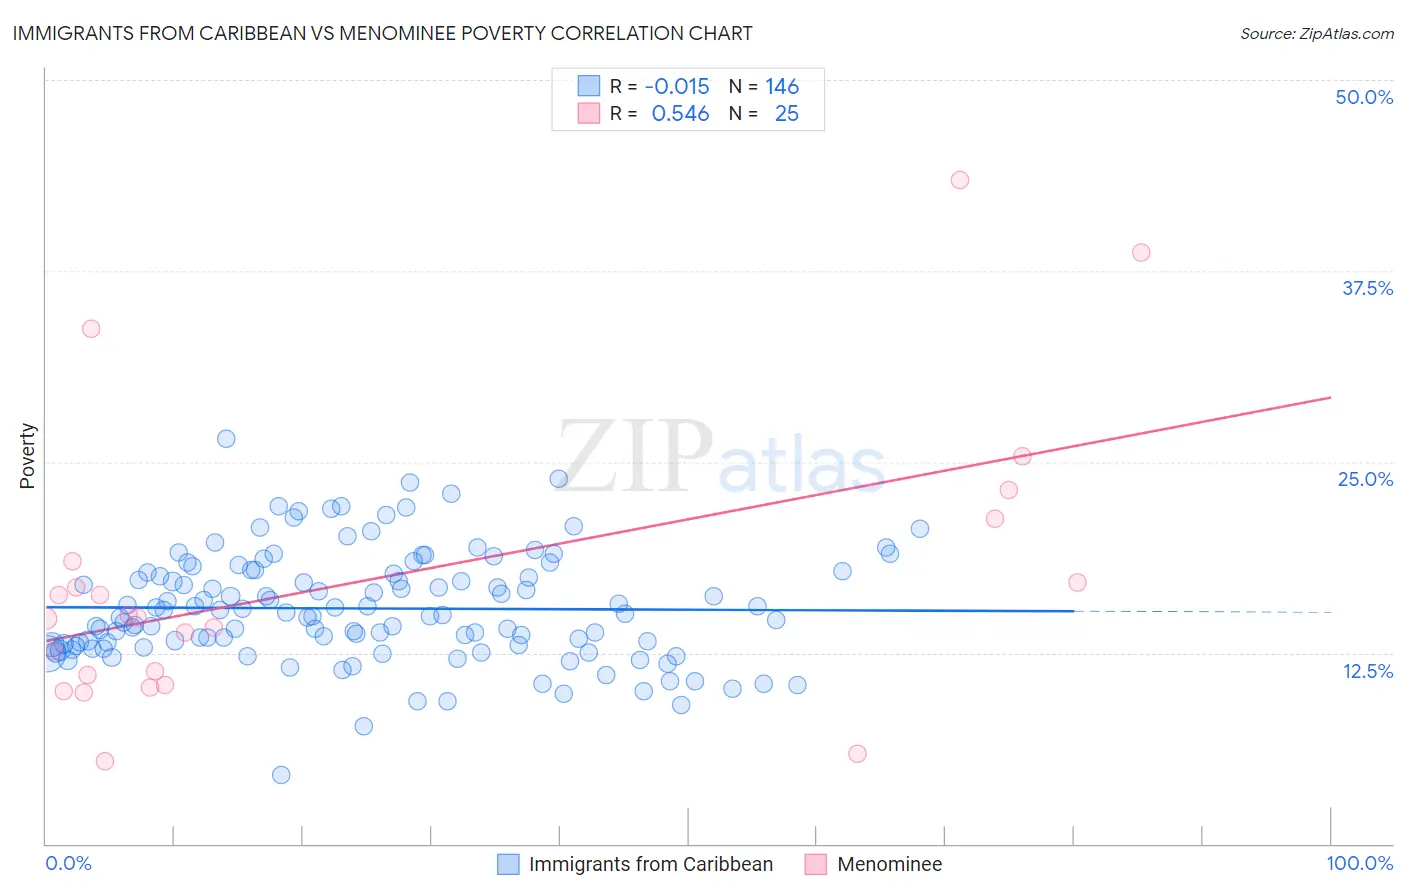
Immigrants from Caribbean vs Menominee Poverty Correlation Chart
The statistical analysis conducted on geographies consisting of 449,609,031 people shows no correlation between the proportion of Immigrants from Caribbean and poverty level in the United States with a correlation coefficient (R) of -0.015 and weighted average of 15.5%. Similarly, the statistical analysis conducted on geographies consisting of 45,777,730 people shows a substantial positive correlation between the proportion of Menominee and poverty level in the United States with a correlation coefficient (R) of 0.546 and weighted average of 16.4%, a difference of 6.2%.
Poverty Correlation Summary
| Measurement | Immigrants from Caribbean | Menominee |
| Minimum | 4.5% | 5.4% |
| Maximum | 26.5% | 43.5% |
| Range | 22.0% | 38.1% |
| Mean | 15.4% | 17.2% |
| Median | 15.0% | 14.8% |
| Interquartile 25% (IQ1) | 13.0% | 10.7% |
| Interquartile 75% (IQ3) | 17.7% | 19.9% |
| Interquartile Range (IQR) | 4.8% | 9.2% |
| Standard Deviation (Sample) | 3.6% | 9.5% |
| Standard Deviation (Population) | 3.6% | 9.3% |
Demographics Similar to Immigrants from Caribbean and Menominee by Poverty
In terms of poverty, the demographic groups most similar to Immigrants from Caribbean are Immigrants from Mexico (15.5%, a difference of 0.090%), Immigrants from Guatemala (15.5%, a difference of 0.12%), Somali (15.4%, a difference of 0.48%), Creek (15.6%, a difference of 0.56%), and African (15.6%, a difference of 0.63%). Similarly, the demographic groups most similar to Menominee are Arapaho (16.3%, a difference of 0.96%), Immigrants from Honduras (16.2%, a difference of 1.7%), Immigrants from Congo (16.1%, a difference of 1.9%), Immigrants from Dominica (16.1%, a difference of 2.1%), and U.S. Virgin Islander (16.1%, a difference of 2.4%).
| Demographics | Rating | Rank | Poverty |
| Somalis | 0.0 /100 | #302 | Tragic 15.4% |
| Immigrants | Caribbean | 0.0 /100 | #303 | Tragic 15.5% |
| Immigrants | Mexico | 0.0 /100 | #304 | Tragic 15.5% |
| Immigrants | Guatemala | 0.0 /100 | #305 | Tragic 15.5% |
| Creek | 0.0 /100 | #306 | Tragic 15.6% |
| Africans | 0.0 /100 | #307 | Tragic 15.6% |
| Choctaw | 0.0 /100 | #308 | Tragic 15.6% |
| Seminole | 0.0 /100 | #309 | Tragic 15.6% |
| Dutch West Indians | 0.0 /100 | #310 | Tragic 15.6% |
| Chippewa | 0.0 /100 | #311 | Tragic 15.7% |
| Cajuns | 0.0 /100 | #312 | Tragic 15.7% |
| Immigrants | Grenada | 0.0 /100 | #313 | Tragic 15.8% |
| Immigrants | Somalia | 0.0 /100 | #314 | Tragic 15.8% |
| British West Indians | 0.0 /100 | #315 | Tragic 15.9% |
| Hondurans | 0.0 /100 | #316 | Tragic 15.9% |
| U.S. Virgin Islanders | 0.0 /100 | #317 | Tragic 16.1% |
| Immigrants | Dominica | 0.0 /100 | #318 | Tragic 16.1% |
| Immigrants | Congo | 0.0 /100 | #319 | Tragic 16.1% |
| Immigrants | Honduras | 0.0 /100 | #320 | Tragic 16.2% |
| Arapaho | 0.0 /100 | #321 | Tragic 16.3% |
| Menominee | 0.0 /100 | #322 | Tragic 16.4% |