Immigrants from Caribbean vs Iranian Poverty
COMPARE
Immigrants from Caribbean
Iranian
Poverty
Poverty Comparison
Immigrants from Caribbean
Iranians
15.5%
POVERTY
0.0/ 100
METRIC RATING
303rd/ 347
METRIC RANK
10.7%
POVERTY
99.5/ 100
METRIC RATING
32nd/ 347
METRIC RANK
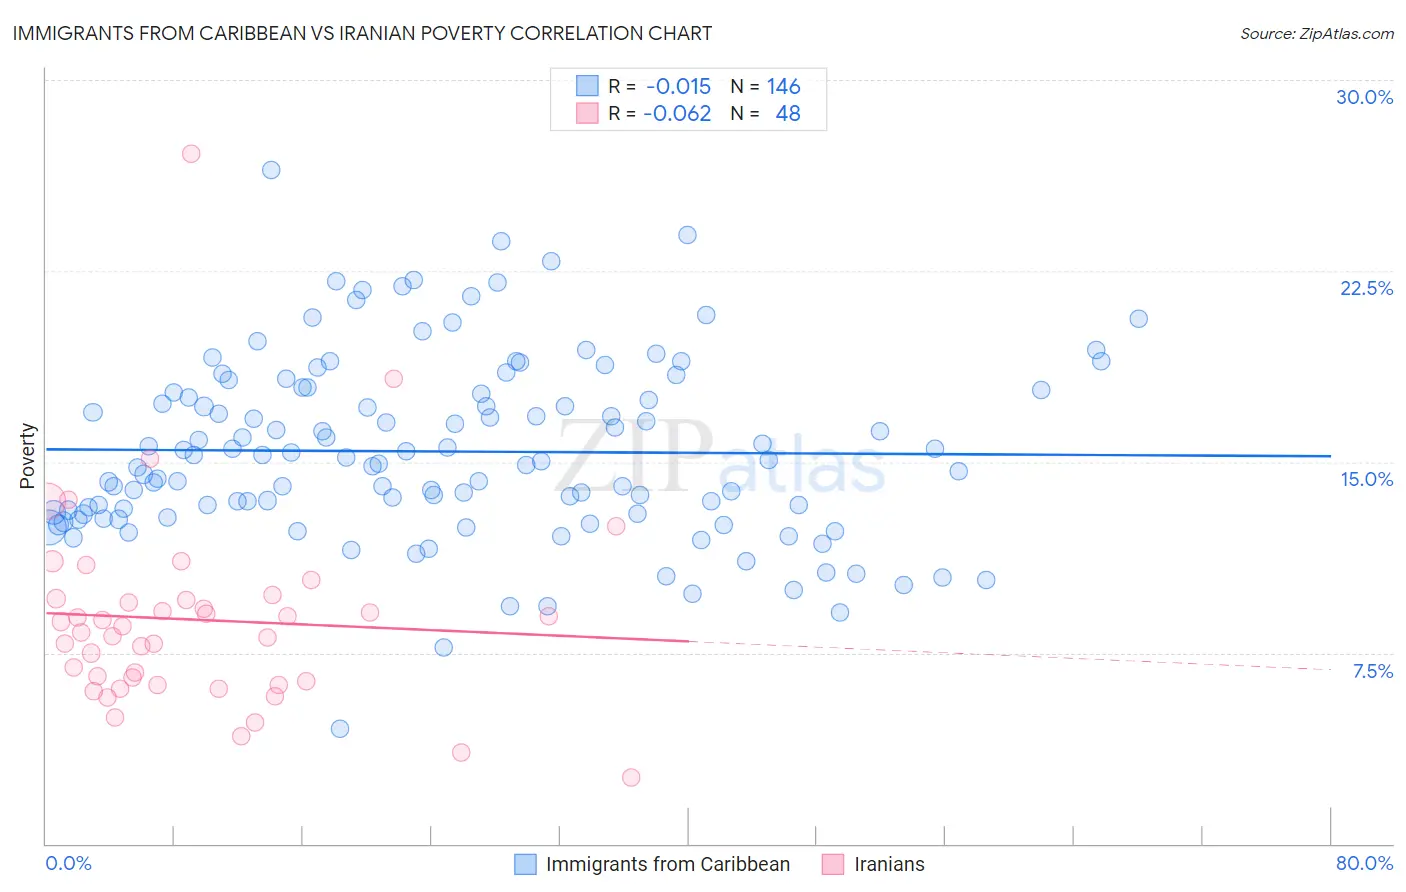
Immigrants from Caribbean vs Iranian Poverty Correlation Chart
The statistical analysis conducted on geographies consisting of 449,609,031 people shows no correlation between the proportion of Immigrants from Caribbean and poverty level in the United States with a correlation coefficient (R) of -0.015 and weighted average of 15.5%. Similarly, the statistical analysis conducted on geographies consisting of 316,670,706 people shows a slight negative correlation between the proportion of Iranians and poverty level in the United States with a correlation coefficient (R) of -0.062 and weighted average of 10.7%, a difference of 44.2%.
Poverty Correlation Summary
| Measurement | Immigrants from Caribbean | Iranian |
| Minimum | 4.5% | 2.6% |
| Maximum | 26.5% | 27.1% |
| Range | 22.0% | 24.5% |
| Mean | 15.4% | 8.8% |
| Median | 15.0% | 8.4% |
| Interquartile 25% (IQ1) | 13.0% | 6.3% |
| Interquartile 75% (IQ3) | 17.7% | 9.6% |
| Interquartile Range (IQR) | 4.8% | 3.3% |
| Standard Deviation (Sample) | 3.6% | 4.0% |
| Standard Deviation (Population) | 3.6% | 3.9% |
Similar Demographics by Poverty
Demographics Similar to Immigrants from Caribbean by Poverty
In terms of poverty, the demographic groups most similar to Immigrants from Caribbean are Immigrants from Mexico (15.5%, a difference of 0.090%), Immigrants from Guatemala (15.5%, a difference of 0.12%), Somali (15.4%, a difference of 0.48%), Creek (15.6%, a difference of 0.56%), and Bahamian (15.4%, a difference of 0.61%).
| Demographics | Rating | Rank | Poverty |
| Hispanics or Latinos | 0.0 /100 | #296 | Tragic 15.3% |
| Immigrants | Bangladesh | 0.0 /100 | #297 | Tragic 15.3% |
| Immigrants | Senegal | 0.0 /100 | #298 | Tragic 15.3% |
| Senegalese | 0.0 /100 | #299 | Tragic 15.3% |
| Immigrants | Central America | 0.0 /100 | #300 | Tragic 15.4% |
| Bahamians | 0.0 /100 | #301 | Tragic 15.4% |
| Somalis | 0.0 /100 | #302 | Tragic 15.4% |
| Immigrants | Caribbean | 0.0 /100 | #303 | Tragic 15.5% |
| Immigrants | Mexico | 0.0 /100 | #304 | Tragic 15.5% |
| Immigrants | Guatemala | 0.0 /100 | #305 | Tragic 15.5% |
| Creek | 0.0 /100 | #306 | Tragic 15.6% |
| Africans | 0.0 /100 | #307 | Tragic 15.6% |
| Choctaw | 0.0 /100 | #308 | Tragic 15.6% |
| Seminole | 0.0 /100 | #309 | Tragic 15.6% |
| Dutch West Indians | 0.0 /100 | #310 | Tragic 15.6% |
Demographics Similar to Iranians by Poverty
In terms of poverty, the demographic groups most similar to Iranians are Polish (10.7%, a difference of 0.090%), Danish (10.7%, a difference of 0.17%), Greek (10.7%, a difference of 0.18%), Immigrants from Korea (10.7%, a difference of 0.27%), and Immigrants from Northern Europe (10.7%, a difference of 0.34%).
| Demographics | Rating | Rank | Poverty |
| Croatians | 99.6 /100 | #25 | Exceptional 10.6% |
| Burmese | 99.6 /100 | #26 | Exceptional 10.7% |
| Immigrants | Northern Europe | 99.6 /100 | #27 | Exceptional 10.7% |
| Immigrants | Korea | 99.5 /100 | #28 | Exceptional 10.7% |
| Greeks | 99.5 /100 | #29 | Exceptional 10.7% |
| Danes | 99.5 /100 | #30 | Exceptional 10.7% |
| Poles | 99.5 /100 | #31 | Exceptional 10.7% |
| Iranians | 99.5 /100 | #32 | Exceptional 10.7% |
| Macedonians | 99.4 /100 | #33 | Exceptional 10.8% |
| Immigrants | Poland | 99.4 /100 | #34 | Exceptional 10.8% |
| Tongans | 99.4 /100 | #35 | Exceptional 10.8% |
| Cypriots | 99.3 /100 | #36 | Exceptional 10.8% |
| Immigrants | Greece | 99.3 /100 | #37 | Exceptional 10.8% |
| Czechs | 99.3 /100 | #38 | Exceptional 10.8% |
| Immigrants | Pakistan | 99.3 /100 | #39 | Exceptional 10.8% |