Immigrants from Caribbean vs Immigrants from Zimbabwe Poverty
COMPARE
Immigrants from Caribbean
Immigrants from Zimbabwe
Poverty
Poverty Comparison
Immigrants from Caribbean
Immigrants from Zimbabwe
15.5%
POVERTY
0.0/ 100
METRIC RATING
303rd/ 347
METRIC RANK
11.6%
POVERTY
92.1/ 100
METRIC RATING
106th/ 347
METRIC RANK
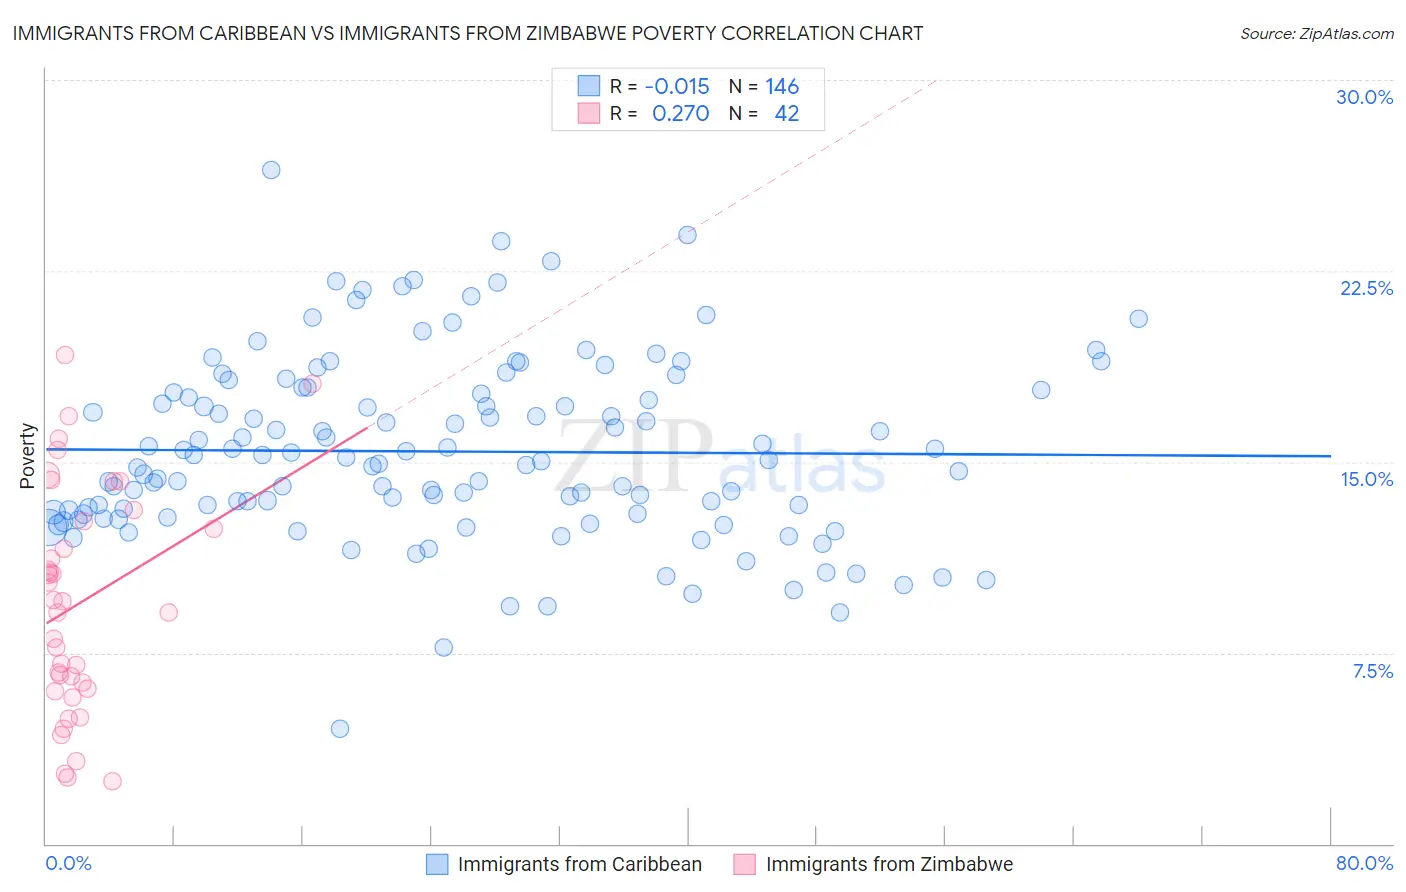
Immigrants from Caribbean vs Immigrants from Zimbabwe Poverty Correlation Chart
The statistical analysis conducted on geographies consisting of 449,609,031 people shows no correlation between the proportion of Immigrants from Caribbean and poverty level in the United States with a correlation coefficient (R) of -0.015 and weighted average of 15.5%. Similarly, the statistical analysis conducted on geographies consisting of 117,789,316 people shows a weak positive correlation between the proportion of Immigrants from Zimbabwe and poverty level in the United States with a correlation coefficient (R) of 0.270 and weighted average of 11.6%, a difference of 33.7%.
Poverty Correlation Summary
| Measurement | Immigrants from Caribbean | Immigrants from Zimbabwe |
| Minimum | 4.5% | 2.4% |
| Maximum | 26.5% | 19.2% |
| Range | 22.0% | 16.7% |
| Mean | 15.4% | 9.5% |
| Median | 15.0% | 9.3% |
| Interquartile 25% (IQ1) | 13.0% | 6.1% |
| Interquartile 75% (IQ3) | 17.7% | 12.7% |
| Interquartile Range (IQR) | 4.8% | 6.6% |
| Standard Deviation (Sample) | 3.6% | 4.4% |
| Standard Deviation (Population) | 3.6% | 4.4% |
Similar Demographics by Poverty
Demographics Similar to Immigrants from Caribbean by Poverty
In terms of poverty, the demographic groups most similar to Immigrants from Caribbean are Immigrants from Mexico (15.5%, a difference of 0.090%), Immigrants from Guatemala (15.5%, a difference of 0.12%), Somali (15.4%, a difference of 0.48%), Creek (15.6%, a difference of 0.56%), and Bahamian (15.4%, a difference of 0.61%).
| Demographics | Rating | Rank | Poverty |
| Hispanics or Latinos | 0.0 /100 | #296 | Tragic 15.3% |
| Immigrants | Bangladesh | 0.0 /100 | #297 | Tragic 15.3% |
| Immigrants | Senegal | 0.0 /100 | #298 | Tragic 15.3% |
| Senegalese | 0.0 /100 | #299 | Tragic 15.3% |
| Immigrants | Central America | 0.0 /100 | #300 | Tragic 15.4% |
| Bahamians | 0.0 /100 | #301 | Tragic 15.4% |
| Somalis | 0.0 /100 | #302 | Tragic 15.4% |
| Immigrants | Caribbean | 0.0 /100 | #303 | Tragic 15.5% |
| Immigrants | Mexico | 0.0 /100 | #304 | Tragic 15.5% |
| Immigrants | Guatemala | 0.0 /100 | #305 | Tragic 15.5% |
| Creek | 0.0 /100 | #306 | Tragic 15.6% |
| Africans | 0.0 /100 | #307 | Tragic 15.6% |
| Choctaw | 0.0 /100 | #308 | Tragic 15.6% |
| Seminole | 0.0 /100 | #309 | Tragic 15.6% |
| Dutch West Indians | 0.0 /100 | #310 | Tragic 15.6% |
Demographics Similar to Immigrants from Zimbabwe by Poverty
In terms of poverty, the demographic groups most similar to Immigrants from Zimbabwe are Portuguese (11.6%, a difference of 0.0%), Native Hawaiian (11.6%, a difference of 0.020%), Palestinian (11.6%, a difference of 0.090%), Canadian (11.6%, a difference of 0.12%), and Laotian (11.6%, a difference of 0.13%).
| Demographics | Rating | Rank | Poverty |
| Immigrants | Indonesia | 94.2 /100 | #99 | Exceptional 11.5% |
| Scottish | 94.0 /100 | #100 | Exceptional 11.5% |
| Slavs | 93.3 /100 | #101 | Exceptional 11.5% |
| Laotians | 92.4 /100 | #102 | Exceptional 11.6% |
| Okinawans | 92.4 /100 | #103 | Exceptional 11.6% |
| Native Hawaiians | 92.1 /100 | #104 | Exceptional 11.6% |
| Portuguese | 92.1 /100 | #105 | Exceptional 11.6% |
| Immigrants | Zimbabwe | 92.1 /100 | #106 | Exceptional 11.6% |
| Palestinians | 91.8 /100 | #107 | Exceptional 11.6% |
| Canadians | 91.7 /100 | #108 | Exceptional 11.6% |
| Immigrants | Turkey | 91.7 /100 | #109 | Exceptional 11.6% |
| Welsh | 91.6 /100 | #110 | Exceptional 11.6% |
| French Canadians | 91.0 /100 | #111 | Exceptional 11.6% |
| Immigrants | Southern Europe | 90.8 /100 | #112 | Exceptional 11.6% |
| Immigrants | Belarus | 90.8 /100 | #113 | Exceptional 11.6% |