Immigrants from Caribbean vs Immigrants from Haiti Poverty
COMPARE
Immigrants from Caribbean
Immigrants from Haiti
Poverty
Poverty Comparison
Immigrants from Caribbean
Immigrants from Haiti
15.5%
POVERTY
0.0/ 100
METRIC RATING
303rd/ 347
METRIC RANK
15.0%
POVERTY
0.0/ 100
METRIC RATING
283rd/ 347
METRIC RANK
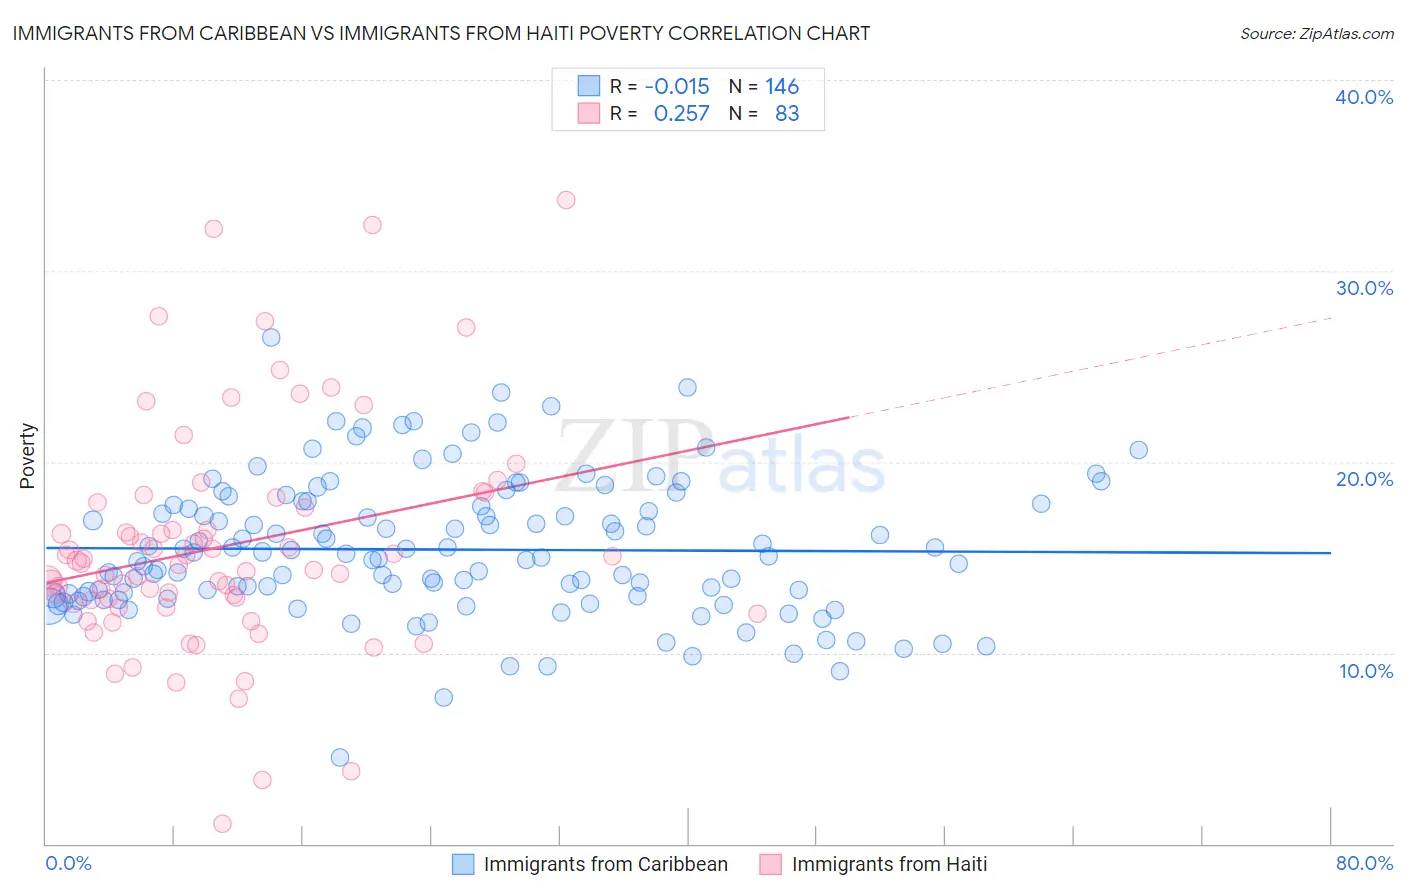
Immigrants from Caribbean vs Immigrants from Haiti Poverty Correlation Chart
The statistical analysis conducted on geographies consisting of 449,609,031 people shows no correlation between the proportion of Immigrants from Caribbean and poverty level in the United States with a correlation coefficient (R) of -0.015 and weighted average of 15.5%. Similarly, the statistical analysis conducted on geographies consisting of 225,178,584 people shows a weak positive correlation between the proportion of Immigrants from Haiti and poverty level in the United States with a correlation coefficient (R) of 0.257 and weighted average of 15.0%, a difference of 3.4%.
Poverty Correlation Summary
| Measurement | Immigrants from Caribbean | Immigrants from Haiti |
| Minimum | 4.5% | 1.1% |
| Maximum | 26.5% | 33.7% |
| Range | 22.0% | 32.7% |
| Mean | 15.4% | 15.6% |
| Median | 15.0% | 14.7% |
| Interquartile 25% (IQ1) | 13.0% | 12.6% |
| Interquartile 75% (IQ3) | 17.7% | 17.9% |
| Interquartile Range (IQR) | 4.8% | 5.3% |
| Standard Deviation (Sample) | 3.6% | 5.9% |
| Standard Deviation (Population) | 3.6% | 5.9% |
Demographics Similar to Immigrants from Caribbean and Immigrants from Haiti by Poverty
In terms of poverty, the demographic groups most similar to Immigrants from Caribbean are Somali (15.4%, a difference of 0.48%), Bahamian (15.4%, a difference of 0.61%), Immigrants from Central America (15.4%, a difference of 0.82%), Senegalese (15.3%, a difference of 1.2%), and Immigrants from Senegal (15.3%, a difference of 1.3%). Similarly, the demographic groups most similar to Immigrants from Haiti are West Indian (15.0%, a difference of 0.10%), Vietnamese (15.0%, a difference of 0.16%), Immigrants from Latin America (15.0%, a difference of 0.42%), Inupiat (15.1%, a difference of 0.63%), and Yaqui (15.1%, a difference of 0.64%).
| Demographics | Rating | Rank | Poverty |
| Immigrants | Haiti | 0.0 /100 | #283 | Tragic 15.0% |
| West Indians | 0.0 /100 | #284 | Tragic 15.0% |
| Vietnamese | 0.0 /100 | #285 | Tragic 15.0% |
| Immigrants | Latin America | 0.0 /100 | #286 | Tragic 15.0% |
| Inupiat | 0.0 /100 | #287 | Tragic 15.1% |
| Yaqui | 0.0 /100 | #288 | Tragic 15.1% |
| Immigrants | Belize | 0.0 /100 | #289 | Tragic 15.1% |
| Mexicans | 0.0 /100 | #290 | Tragic 15.1% |
| Immigrants | Cabo Verde | 0.0 /100 | #291 | Tragic 15.1% |
| Indonesians | 0.0 /100 | #292 | Tragic 15.1% |
| Immigrants | Zaire | 0.0 /100 | #293 | Tragic 15.1% |
| Blackfeet | 0.0 /100 | #294 | Tragic 15.2% |
| Guatemalans | 0.0 /100 | #295 | Tragic 15.3% |
| Hispanics or Latinos | 0.0 /100 | #296 | Tragic 15.3% |
| Immigrants | Bangladesh | 0.0 /100 | #297 | Tragic 15.3% |
| Immigrants | Senegal | 0.0 /100 | #298 | Tragic 15.3% |
| Senegalese | 0.0 /100 | #299 | Tragic 15.3% |
| Immigrants | Central America | 0.0 /100 | #300 | Tragic 15.4% |
| Bahamians | 0.0 /100 | #301 | Tragic 15.4% |
| Somalis | 0.0 /100 | #302 | Tragic 15.4% |
| Immigrants | Caribbean | 0.0 /100 | #303 | Tragic 15.5% |