Immigrants from Caribbean vs Immigrants from Vietnam Poverty
COMPARE
Immigrants from Caribbean
Immigrants from Vietnam
Poverty
Poverty Comparison
Immigrants from Caribbean
Immigrants from Vietnam
15.5%
POVERTY
0.0/ 100
METRIC RATING
303rd/ 347
METRIC RANK
11.8%
POVERTY
85.2/ 100
METRIC RATING
135th/ 347
METRIC RANK
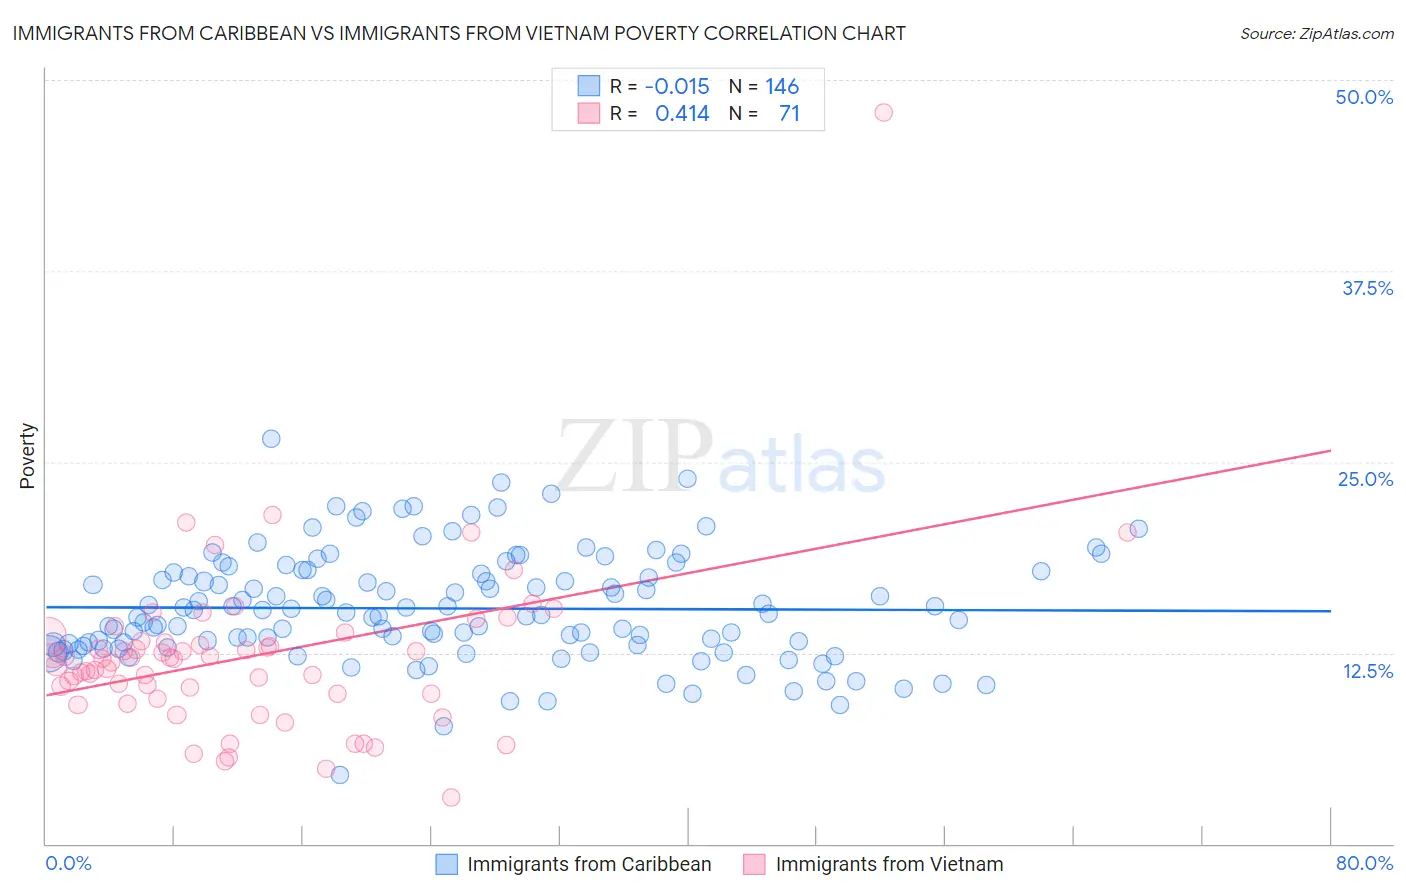
Immigrants from Caribbean vs Immigrants from Vietnam Poverty Correlation Chart
The statistical analysis conducted on geographies consisting of 449,609,031 people shows no correlation between the proportion of Immigrants from Caribbean and poverty level in the United States with a correlation coefficient (R) of -0.015 and weighted average of 15.5%. Similarly, the statistical analysis conducted on geographies consisting of 404,593,024 people shows a moderate positive correlation between the proportion of Immigrants from Vietnam and poverty level in the United States with a correlation coefficient (R) of 0.414 and weighted average of 11.8%, a difference of 31.3%.
Poverty Correlation Summary
| Measurement | Immigrants from Caribbean | Immigrants from Vietnam |
| Minimum | 4.5% | 3.0% |
| Maximum | 26.5% | 47.9% |
| Range | 22.0% | 44.9% |
| Mean | 15.4% | 12.3% |
| Median | 15.0% | 12.1% |
| Interquartile 25% (IQ1) | 13.0% | 9.8% |
| Interquartile 75% (IQ3) | 17.7% | 13.2% |
| Interquartile Range (IQR) | 4.8% | 3.4% |
| Standard Deviation (Sample) | 3.6% | 5.7% |
| Standard Deviation (Population) | 3.6% | 5.7% |
Similar Demographics by Poverty
Demographics Similar to Immigrants from Caribbean by Poverty
In terms of poverty, the demographic groups most similar to Immigrants from Caribbean are Immigrants from Mexico (15.5%, a difference of 0.090%), Immigrants from Guatemala (15.5%, a difference of 0.12%), Somali (15.4%, a difference of 0.48%), Creek (15.6%, a difference of 0.56%), and Bahamian (15.4%, a difference of 0.61%).
| Demographics | Rating | Rank | Poverty |
| Hispanics or Latinos | 0.0 /100 | #296 | Tragic 15.3% |
| Immigrants | Bangladesh | 0.0 /100 | #297 | Tragic 15.3% |
| Immigrants | Senegal | 0.0 /100 | #298 | Tragic 15.3% |
| Senegalese | 0.0 /100 | #299 | Tragic 15.3% |
| Immigrants | Central America | 0.0 /100 | #300 | Tragic 15.4% |
| Bahamians | 0.0 /100 | #301 | Tragic 15.4% |
| Somalis | 0.0 /100 | #302 | Tragic 15.4% |
| Immigrants | Caribbean | 0.0 /100 | #303 | Tragic 15.5% |
| Immigrants | Mexico | 0.0 /100 | #304 | Tragic 15.5% |
| Immigrants | Guatemala | 0.0 /100 | #305 | Tragic 15.5% |
| Creek | 0.0 /100 | #306 | Tragic 15.6% |
| Africans | 0.0 /100 | #307 | Tragic 15.6% |
| Choctaw | 0.0 /100 | #308 | Tragic 15.6% |
| Seminole | 0.0 /100 | #309 | Tragic 15.6% |
| Dutch West Indians | 0.0 /100 | #310 | Tragic 15.6% |
Demographics Similar to Immigrants from Vietnam by Poverty
In terms of poverty, the demographic groups most similar to Immigrants from Vietnam are Yugoslavian (11.8%, a difference of 0.010%), Immigrants from Western Europe (11.8%, a difference of 0.020%), Peruvian (11.8%, a difference of 0.090%), Chilean (11.8%, a difference of 0.19%), and French (11.8%, a difference of 0.20%).
| Demographics | Rating | Rank | Poverty |
| Immigrants | Israel | 87.4 /100 | #128 | Excellent 11.7% |
| South Africans | 87.0 /100 | #129 | Excellent 11.7% |
| Immigrants | Ukraine | 86.6 /100 | #130 | Excellent 11.8% |
| French | 86.1 /100 | #131 | Excellent 11.8% |
| Peruvians | 85.6 /100 | #132 | Excellent 11.8% |
| Immigrants | Western Europe | 85.2 /100 | #133 | Excellent 11.8% |
| Yugoslavians | 85.2 /100 | #134 | Excellent 11.8% |
| Immigrants | Vietnam | 85.2 /100 | #135 | Excellent 11.8% |
| Chileans | 84.2 /100 | #136 | Excellent 11.8% |
| Immigrants | Switzerland | 83.0 /100 | #137 | Excellent 11.8% |
| Immigrants | Jordan | 82.4 /100 | #138 | Excellent 11.9% |
| Pakistanis | 82.2 /100 | #139 | Excellent 11.9% |
| Immigrants | Peru | 81.1 /100 | #140 | Excellent 11.9% |
| Immigrants | France | 80.5 /100 | #141 | Excellent 11.9% |
| Basques | 80.4 /100 | #142 | Excellent 11.9% |