Immigrants from Caribbean vs Comanche Poverty
COMPARE
Immigrants from Caribbean
Comanche
Poverty
Poverty Comparison
Immigrants from Caribbean
Comanche
15.5%
POVERTY
0.0/ 100
METRIC RATING
303rd/ 347
METRIC RANK
15.0%
POVERTY
0.0/ 100
METRIC RATING
282nd/ 347
METRIC RANK
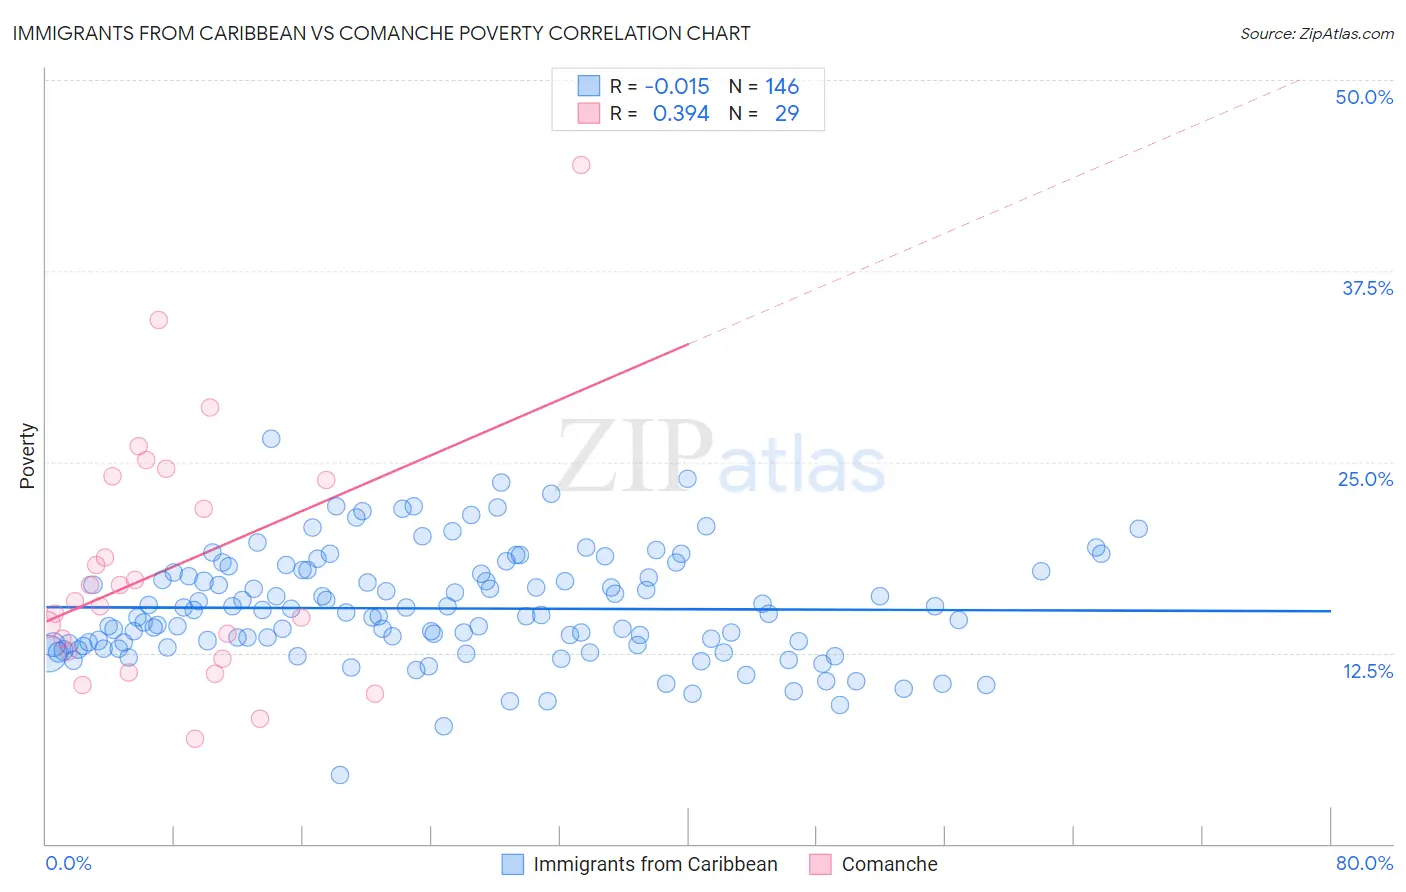
Immigrants from Caribbean vs Comanche Poverty Correlation Chart
The statistical analysis conducted on geographies consisting of 449,609,031 people shows no correlation between the proportion of Immigrants from Caribbean and poverty level in the United States with a correlation coefficient (R) of -0.015 and weighted average of 15.5%. Similarly, the statistical analysis conducted on geographies consisting of 109,758,867 people shows a mild positive correlation between the proportion of Comanche and poverty level in the United States with a correlation coefficient (R) of 0.394 and weighted average of 15.0%, a difference of 3.6%.
Poverty Correlation Summary
| Measurement | Immigrants from Caribbean | Comanche |
| Minimum | 4.5% | 6.8% |
| Maximum | 26.5% | 44.4% |
| Range | 22.0% | 37.6% |
| Mean | 15.4% | 18.1% |
| Median | 15.0% | 15.9% |
| Interquartile 25% (IQ1) | 13.0% | 12.4% |
| Interquartile 75% (IQ3) | 17.7% | 24.0% |
| Interquartile Range (IQR) | 4.8% | 11.6% |
| Standard Deviation (Sample) | 3.6% | 8.3% |
| Standard Deviation (Population) | 3.6% | 8.1% |
Similar Demographics by Poverty
Demographics Similar to Immigrants from Caribbean by Poverty
In terms of poverty, the demographic groups most similar to Immigrants from Caribbean are Immigrants from Mexico (15.5%, a difference of 0.090%), Immigrants from Guatemala (15.5%, a difference of 0.12%), Somali (15.4%, a difference of 0.48%), Creek (15.6%, a difference of 0.56%), and Bahamian (15.4%, a difference of 0.61%).
| Demographics | Rating | Rank | Poverty |
| Hispanics or Latinos | 0.0 /100 | #296 | Tragic 15.3% |
| Immigrants | Bangladesh | 0.0 /100 | #297 | Tragic 15.3% |
| Immigrants | Senegal | 0.0 /100 | #298 | Tragic 15.3% |
| Senegalese | 0.0 /100 | #299 | Tragic 15.3% |
| Immigrants | Central America | 0.0 /100 | #300 | Tragic 15.4% |
| Bahamians | 0.0 /100 | #301 | Tragic 15.4% |
| Somalis | 0.0 /100 | #302 | Tragic 15.4% |
| Immigrants | Caribbean | 0.0 /100 | #303 | Tragic 15.5% |
| Immigrants | Mexico | 0.0 /100 | #304 | Tragic 15.5% |
| Immigrants | Guatemala | 0.0 /100 | #305 | Tragic 15.5% |
| Creek | 0.0 /100 | #306 | Tragic 15.6% |
| Africans | 0.0 /100 | #307 | Tragic 15.6% |
| Choctaw | 0.0 /100 | #308 | Tragic 15.6% |
| Seminole | 0.0 /100 | #309 | Tragic 15.6% |
| Dutch West Indians | 0.0 /100 | #310 | Tragic 15.6% |
Demographics Similar to Comanche by Poverty
In terms of poverty, the demographic groups most similar to Comanche are Immigrants from Haiti (15.0%, a difference of 0.12%), West Indian (15.0%, a difference of 0.23%), Vietnamese (15.0%, a difference of 0.28%), Immigrants from Barbados (14.9%, a difference of 0.33%), and Haitian (14.9%, a difference of 0.40%).
| Demographics | Rating | Rank | Poverty |
| Immigrants | West Indies | 0.0 /100 | #275 | Tragic 14.8% |
| Immigrants | Bahamas | 0.0 /100 | #276 | Tragic 14.8% |
| Bangladeshis | 0.0 /100 | #277 | Tragic 14.8% |
| Belizeans | 0.0 /100 | #278 | Tragic 14.8% |
| Immigrants | St. Vincent and the Grenadines | 0.0 /100 | #279 | Tragic 14.9% |
| Haitians | 0.0 /100 | #280 | Tragic 14.9% |
| Immigrants | Barbados | 0.0 /100 | #281 | Tragic 14.9% |
| Comanche | 0.0 /100 | #282 | Tragic 15.0% |
| Immigrants | Haiti | 0.0 /100 | #283 | Tragic 15.0% |
| West Indians | 0.0 /100 | #284 | Tragic 15.0% |
| Vietnamese | 0.0 /100 | #285 | Tragic 15.0% |
| Immigrants | Latin America | 0.0 /100 | #286 | Tragic 15.0% |
| Inupiat | 0.0 /100 | #287 | Tragic 15.1% |
| Yaqui | 0.0 /100 | #288 | Tragic 15.1% |
| Immigrants | Belize | 0.0 /100 | #289 | Tragic 15.1% |