Immigrants from Iraq vs Thai Poverty
COMPARE
Immigrants from Iraq
Thai
Poverty
Poverty Comparison
Immigrants from Iraq
Thais
12.4%
POVERTY
40.2/ 100
METRIC RATING
183rd/ 347
METRIC RANK
9.6%
POVERTY
100.0/ 100
METRIC RATING
3rd/ 347
METRIC RANK
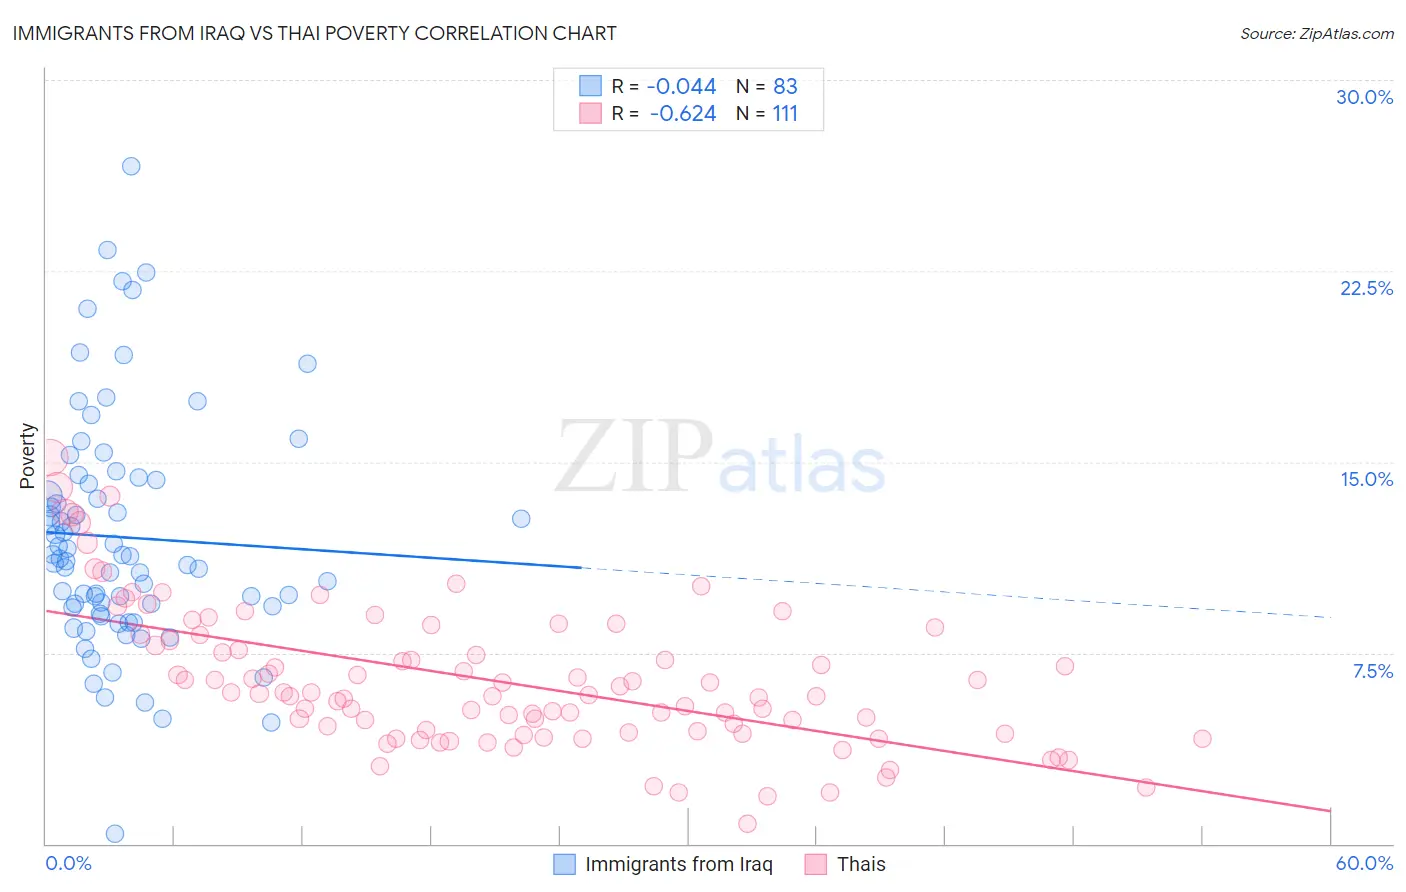
Immigrants from Iraq vs Thai Poverty Correlation Chart
The statistical analysis conducted on geographies consisting of 194,714,900 people shows no correlation between the proportion of Immigrants from Iraq and poverty level in the United States with a correlation coefficient (R) of -0.044 and weighted average of 12.4%. Similarly, the statistical analysis conducted on geographies consisting of 475,359,264 people shows a significant negative correlation between the proportion of Thais and poverty level in the United States with a correlation coefficient (R) of -0.624 and weighted average of 9.6%, a difference of 29.7%.
Poverty Correlation Summary
| Measurement | Immigrants from Iraq | Thai |
| Minimum | 0.40% | 0.80% |
| Maximum | 26.6% | 15.1% |
| Range | 26.2% | 14.4% |
| Mean | 12.0% | 6.4% |
| Median | 11.2% | 5.9% |
| Interquartile 25% (IQ1) | 9.3% | 4.4% |
| Interquartile 75% (IQ3) | 14.3% | 8.2% |
| Interquartile Range (IQR) | 5.0% | 3.9% |
| Standard Deviation (Sample) | 4.6% | 2.8% |
| Standard Deviation (Population) | 4.6% | 2.8% |
Similar Demographics by Poverty
Demographics Similar to Immigrants from Iraq by Poverty
In terms of poverty, the demographic groups most similar to Immigrants from Iraq are Kenyan (12.5%, a difference of 0.13%), Immigrants from Cameroon (12.4%, a difference of 0.15%), Immigrants from Afghanistan (12.4%, a difference of 0.19%), Mongolian (12.4%, a difference of 0.34%), and Immigrants from Morocco (12.4%, a difference of 0.38%).
| Demographics | Rating | Rank | Poverty |
| Immigrants | Colombia | 47.7 /100 | #176 | Average 12.3% |
| Immigrants | Syria | 47.5 /100 | #177 | Average 12.3% |
| Uruguayans | 44.7 /100 | #178 | Average 12.4% |
| Immigrants | Morocco | 44.0 /100 | #179 | Average 12.4% |
| Mongolians | 43.6 /100 | #180 | Average 12.4% |
| Immigrants | Afghanistan | 42.1 /100 | #181 | Average 12.4% |
| Immigrants | Cameroon | 41.7 /100 | #182 | Average 12.4% |
| Immigrants | Iraq | 40.2 /100 | #183 | Average 12.4% |
| Kenyans | 38.8 /100 | #184 | Fair 12.5% |
| Israelis | 36.4 /100 | #185 | Fair 12.5% |
| Immigrants | Sierra Leone | 36.3 /100 | #186 | Fair 12.5% |
| Hawaiians | 34.1 /100 | #187 | Fair 12.5% |
| Immigrants | Costa Rica | 33.3 /100 | #188 | Fair 12.5% |
| Aleuts | 33.2 /100 | #189 | Fair 12.5% |
| Immigrants | South America | 32.3 /100 | #190 | Fair 12.5% |
Demographics Similar to Thais by Poverty
In terms of poverty, the demographic groups most similar to Thais are Chinese (9.5%, a difference of 0.45%), Immigrants from Taiwan (9.7%, a difference of 1.5%), Immigrants from Ireland (10.1%, a difference of 5.2%), Assyrian/Chaldean/Syriac (10.1%, a difference of 5.3%), and Filipino (10.1%, a difference of 5.5%).
| Demographics | Rating | Rank | Poverty |
| Immigrants | India | 100.0 /100 | #1 | Exceptional 9.0% |
| Chinese | 100.0 /100 | #2 | Exceptional 9.5% |
| Thais | 100.0 /100 | #3 | Exceptional 9.6% |
| Immigrants | Taiwan | 100.0 /100 | #4 | Exceptional 9.7% |
| Immigrants | Ireland | 99.9 /100 | #5 | Exceptional 10.1% |
| Assyrians/Chaldeans/Syriacs | 99.9 /100 | #6 | Exceptional 10.1% |
| Filipinos | 99.9 /100 | #7 | Exceptional 10.1% |
| Maltese | 99.9 /100 | #8 | Exceptional 10.2% |
| Immigrants | South Central Asia | 99.9 /100 | #9 | Exceptional 10.2% |
| Bulgarians | 99.9 /100 | #10 | Exceptional 10.2% |
| Immigrants | Lithuania | 99.9 /100 | #11 | Exceptional 10.3% |
| Bhutanese | 99.8 /100 | #12 | Exceptional 10.4% |
| Immigrants | Hong Kong | 99.8 /100 | #13 | Exceptional 10.4% |
| Immigrants | Bolivia | 99.8 /100 | #14 | Exceptional 10.4% |
| Bolivians | 99.8 /100 | #15 | Exceptional 10.4% |