Immigrants from Caribbean vs Malaysian Poverty
COMPARE
Immigrants from Caribbean
Malaysian
Poverty
Poverty Comparison
Immigrants from Caribbean
Malaysians
15.5%
POVERTY
0.0/ 100
METRIC RATING
303rd/ 347
METRIC RANK
13.1%
POVERTY
6.1/ 100
METRIC RATING
209th/ 347
METRIC RANK
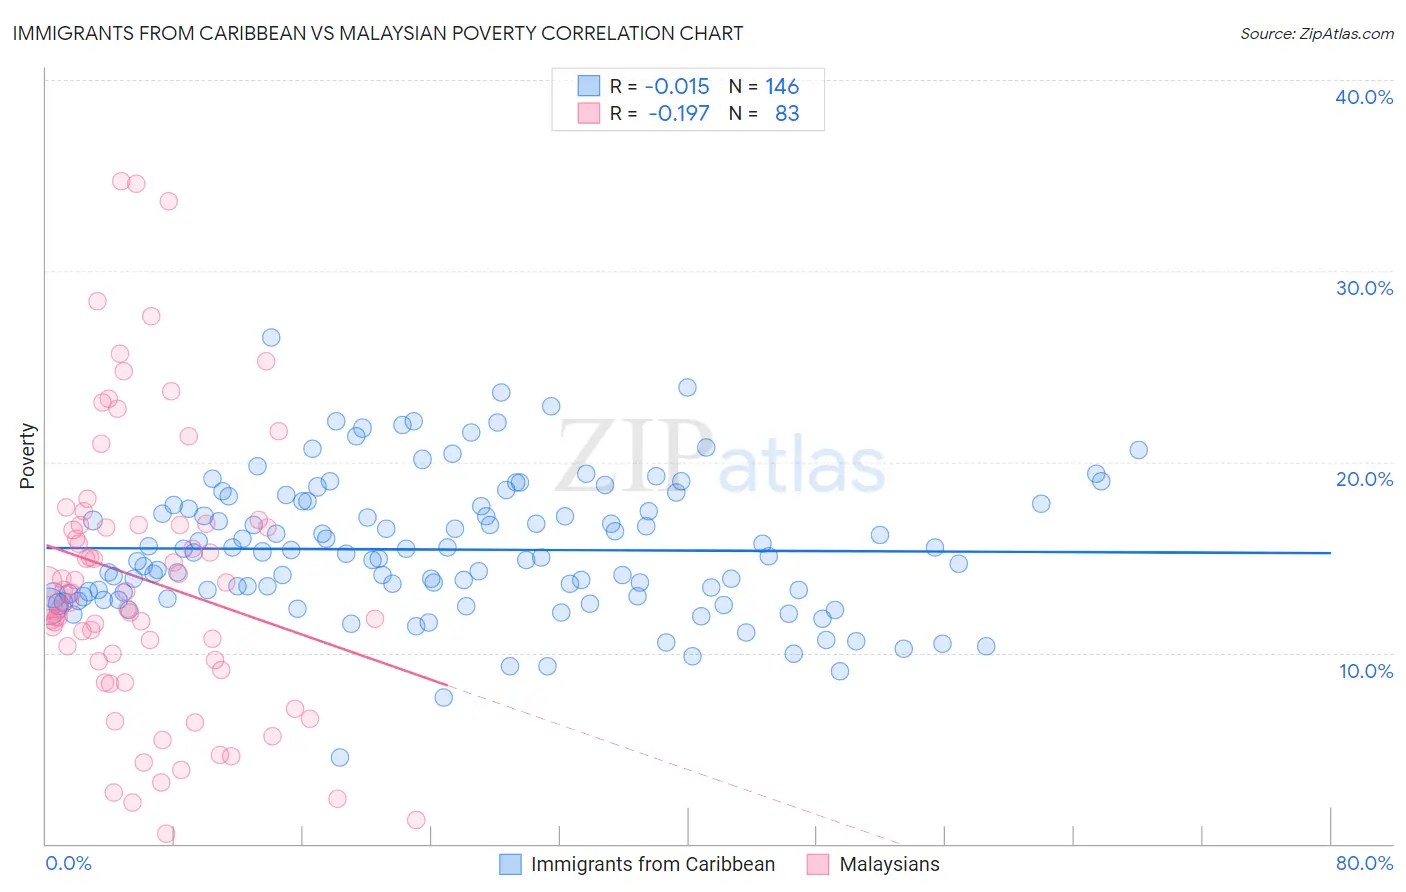
Immigrants from Caribbean vs Malaysian Poverty Correlation Chart
The statistical analysis conducted on geographies consisting of 449,609,031 people shows no correlation between the proportion of Immigrants from Caribbean and poverty level in the United States with a correlation coefficient (R) of -0.015 and weighted average of 15.5%. Similarly, the statistical analysis conducted on geographies consisting of 226,011,043 people shows a poor negative correlation between the proportion of Malaysians and poverty level in the United States with a correlation coefficient (R) of -0.197 and weighted average of 13.1%, a difference of 17.9%.
Poverty Correlation Summary
| Measurement | Immigrants from Caribbean | Malaysian |
| Minimum | 4.5% | 0.56% |
| Maximum | 26.5% | 34.7% |
| Range | 22.0% | 34.2% |
| Mean | 15.4% | 13.8% |
| Median | 15.0% | 13.1% |
| Interquartile 25% (IQ1) | 13.0% | 9.6% |
| Interquartile 75% (IQ3) | 17.7% | 16.7% |
| Interquartile Range (IQR) | 4.8% | 7.1% |
| Standard Deviation (Sample) | 3.6% | 7.4% |
| Standard Deviation (Population) | 3.6% | 7.4% |
Similar Demographics by Poverty
Demographics Similar to Immigrants from Caribbean by Poverty
In terms of poverty, the demographic groups most similar to Immigrants from Caribbean are Immigrants from Mexico (15.5%, a difference of 0.090%), Immigrants from Guatemala (15.5%, a difference of 0.12%), Somali (15.4%, a difference of 0.48%), Creek (15.6%, a difference of 0.56%), and Bahamian (15.4%, a difference of 0.61%).
| Demographics | Rating | Rank | Poverty |
| Hispanics or Latinos | 0.0 /100 | #296 | Tragic 15.3% |
| Immigrants | Bangladesh | 0.0 /100 | #297 | Tragic 15.3% |
| Immigrants | Senegal | 0.0 /100 | #298 | Tragic 15.3% |
| Senegalese | 0.0 /100 | #299 | Tragic 15.3% |
| Immigrants | Central America | 0.0 /100 | #300 | Tragic 15.4% |
| Bahamians | 0.0 /100 | #301 | Tragic 15.4% |
| Somalis | 0.0 /100 | #302 | Tragic 15.4% |
| Immigrants | Caribbean | 0.0 /100 | #303 | Tragic 15.5% |
| Immigrants | Mexico | 0.0 /100 | #304 | Tragic 15.5% |
| Immigrants | Guatemala | 0.0 /100 | #305 | Tragic 15.5% |
| Creek | 0.0 /100 | #306 | Tragic 15.6% |
| Africans | 0.0 /100 | #307 | Tragic 15.6% |
| Choctaw | 0.0 /100 | #308 | Tragic 15.6% |
| Seminole | 0.0 /100 | #309 | Tragic 15.6% |
| Dutch West Indians | 0.0 /100 | #310 | Tragic 15.6% |
Demographics Similar to Malaysians by Poverty
In terms of poverty, the demographic groups most similar to Malaysians are Ugandan (13.1%, a difference of 0.030%), Immigrants from the Azores (13.1%, a difference of 0.030%), Panamanian (13.1%, a difference of 0.18%), Immigrants from Eastern Africa (13.1%, a difference of 0.30%), and Moroccan (13.2%, a difference of 0.38%).
| Demographics | Rating | Rank | Poverty |
| Immigrants | Uruguay | 15.6 /100 | #202 | Poor 12.8% |
| Hmong | 15.0 /100 | #203 | Poor 12.8% |
| Immigrants | Western Asia | 14.1 /100 | #204 | Poor 12.9% |
| Tsimshian | 9.2 /100 | #205 | Tragic 13.0% |
| Immigrants | Eastern Africa | 7.0 /100 | #206 | Tragic 13.1% |
| Panamanians | 6.6 /100 | #207 | Tragic 13.1% |
| Ugandans | 6.2 /100 | #208 | Tragic 13.1% |
| Malaysians | 6.1 /100 | #209 | Tragic 13.1% |
| Immigrants | Azores | 6.1 /100 | #210 | Tragic 13.1% |
| Moroccans | 5.2 /100 | #211 | Tragic 13.2% |
| Immigrants | Immigrants | 4.3 /100 | #212 | Tragic 13.2% |
| Immigrants | Panama | 4.1 /100 | #213 | Tragic 13.3% |
| Bermudans | 3.7 /100 | #214 | Tragic 13.3% |
| Japanese | 3.3 /100 | #215 | Tragic 13.3% |
| Immigrants | Nonimmigrants | 3.3 /100 | #216 | Tragic 13.3% |