Immigrants from Micronesia vs Cheyenne Married-Couple Family Poverty
COMPARE
Immigrants from Micronesia
Cheyenne
Married-Couple Family Poverty
Married-Couple Family Poverty Comparison
Immigrants from Micronesia
Cheyenne
5.5%
MARRIED-COUPLE FAMILY POVERTY
14.4/ 100
METRIC RATING
210th/ 347
METRIC RANK
9.4%
MARRIED-COUPLE FAMILY POVERTY
0.0/ 100
METRIC RATING
338th/ 347
METRIC RANK
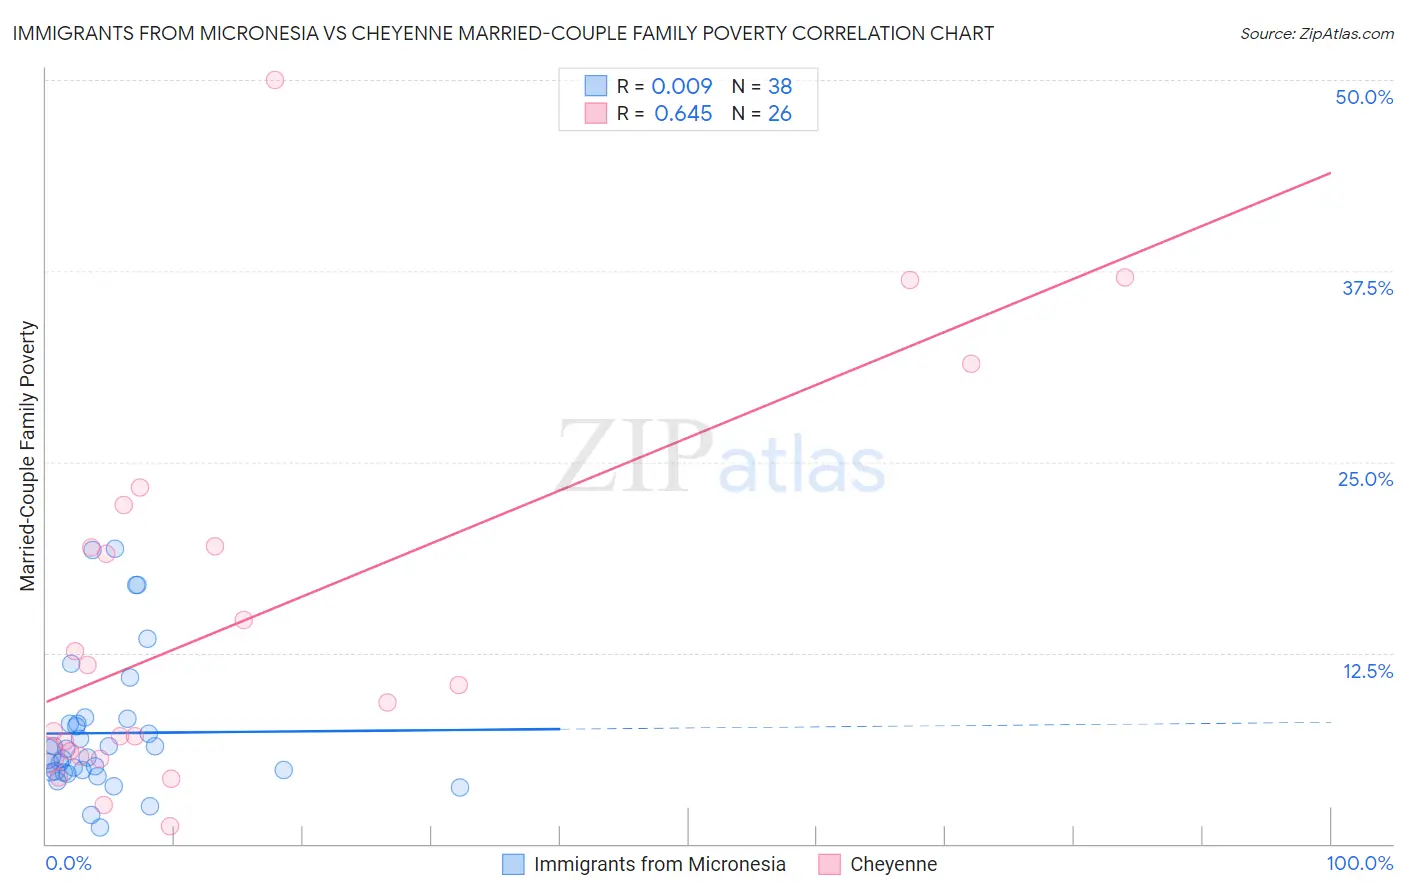
Immigrants from Micronesia vs Cheyenne Married-Couple Family Poverty Correlation Chart
The statistical analysis conducted on geographies consisting of 61,488,987 people shows no correlation between the proportion of Immigrants from Micronesia and poverty level among married-couple families in the United States with a correlation coefficient (R) of 0.009 and weighted average of 5.5%. Similarly, the statistical analysis conducted on geographies consisting of 80,557,927 people shows a significant positive correlation between the proportion of Cheyenne and poverty level among married-couple families in the United States with a correlation coefficient (R) of 0.645 and weighted average of 9.4%, a difference of 71.9%.
Married-Couple Family Poverty Correlation Summary
| Measurement | Immigrants from Micronesia | Cheyenne |
| Minimum | 1.0% | 1.1% |
| Maximum | 19.3% | 50.0% |
| Range | 18.3% | 48.9% |
| Mean | 7.2% | 14.7% |
| Median | 5.8% | 9.8% |
| Interquartile 25% (IQ1) | 4.7% | 5.8% |
| Interquartile 75% (IQ3) | 7.8% | 19.4% |
| Interquartile Range (IQR) | 3.2% | 13.7% |
| Standard Deviation (Sample) | 4.5% | 12.5% |
| Standard Deviation (Population) | 4.4% | 12.2% |
Similar Demographics by Married-Couple Family Poverty
Demographics Similar to Immigrants from Micronesia by Married-Couple Family Poverty
In terms of married-couple family poverty, the demographic groups most similar to Immigrants from Micronesia are Nigerian (5.5%, a difference of 0.020%), Immigrants from Thailand (5.5%, a difference of 0.090%), Immigrants from Syria (5.5%, a difference of 0.21%), Immigrants from Liberia (5.5%, a difference of 0.26%), and Iroquois (5.5%, a difference of 0.31%).
| Demographics | Rating | Rank | Married-Couple Family Poverty |
| Immigrants | Peru | 21.8 /100 | #203 | Fair 5.4% |
| Immigrants | Costa Rica | 19.4 /100 | #204 | Poor 5.4% |
| Chippewa | 18.9 /100 | #205 | Poor 5.4% |
| Osage | 18.4 /100 | #206 | Poor 5.4% |
| Immigrants | Africa | 17.6 /100 | #207 | Poor 5.5% |
| French American Indians | 16.1 /100 | #208 | Poor 5.5% |
| Immigrants | Syria | 15.4 /100 | #209 | Poor 5.5% |
| Immigrants | Micronesia | 14.4 /100 | #210 | Poor 5.5% |
| Nigerians | 14.3 /100 | #211 | Poor 5.5% |
| Immigrants | Thailand | 14.0 /100 | #212 | Poor 5.5% |
| Immigrants | Liberia | 13.3 /100 | #213 | Poor 5.5% |
| Iroquois | 13.1 /100 | #214 | Poor 5.5% |
| Armenians | 12.8 /100 | #215 | Poor 5.5% |
| Potawatomi | 12.4 /100 | #216 | Poor 5.5% |
| Immigrants | Nigeria | 11.3 /100 | #217 | Poor 5.5% |
Demographics Similar to Cheyenne by Married-Couple Family Poverty
In terms of married-couple family poverty, the demographic groups most similar to Cheyenne are Crow (9.6%, a difference of 1.3%), Yuman (9.7%, a difference of 3.2%), Yakama (9.0%, a difference of 5.3%), Apache (9.0%, a difference of 5.4%), and Sioux (8.7%, a difference of 8.5%).
| Demographics | Rating | Rank | Married-Couple Family Poverty |
| Central American Indians | 0.0 /100 | #331 | Tragic 8.3% |
| Dominicans | 0.0 /100 | #332 | Tragic 8.3% |
| Lumbee | 0.0 /100 | #333 | Tragic 8.3% |
| Immigrants | Dominican Republic | 0.0 /100 | #334 | Tragic 8.4% |
| Sioux | 0.0 /100 | #335 | Tragic 8.7% |
| Apache | 0.0 /100 | #336 | Tragic 9.0% |
| Yakama | 0.0 /100 | #337 | Tragic 9.0% |
| Cheyenne | 0.0 /100 | #338 | Tragic 9.4% |
| Crow | 0.0 /100 | #339 | Tragic 9.6% |
| Yuman | 0.0 /100 | #340 | Tragic 9.7% |
| Pueblo | 0.0 /100 | #341 | Tragic 11.1% |
| Tohono O'odham | 0.0 /100 | #342 | Tragic 11.2% |
| Pima | 0.0 /100 | #343 | Tragic 11.4% |
| Navajo | 0.0 /100 | #344 | Tragic 11.9% |
| Puerto Ricans | 0.0 /100 | #345 | Tragic 12.6% |