Seminole vs Immigrants from Nepal Single Mother Poverty
COMPARE
Seminole
Immigrants from Nepal
Single Mother Poverty
Single Mother Poverty Comparison
Seminole
Immigrants from Nepal
35.8%
SINGLE MOTHER POVERTY
0.0/ 100
METRIC RATING
326th/ 347
METRIC RANK
27.9%
SINGLE MOTHER POVERTY
97.2/ 100
METRIC RATING
98th/ 347
METRIC RANK
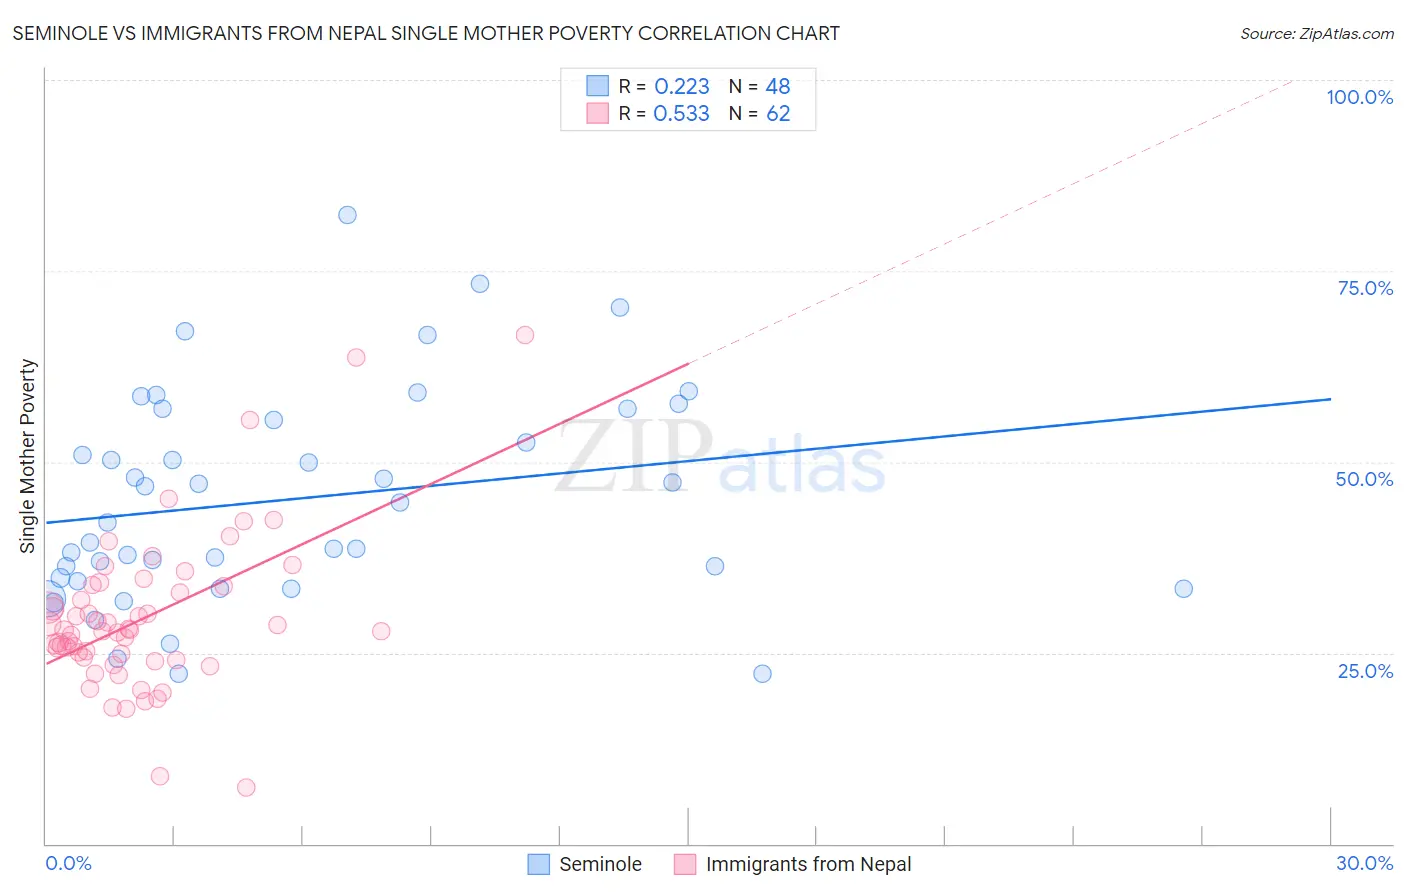
Seminole vs Immigrants from Nepal Single Mother Poverty Correlation Chart
The statistical analysis conducted on geographies consisting of 117,787,190 people shows a weak positive correlation between the proportion of Seminole and poverty level among single mothers in the United States with a correlation coefficient (R) of 0.223 and weighted average of 35.8%. Similarly, the statistical analysis conducted on geographies consisting of 184,396,639 people shows a substantial positive correlation between the proportion of Immigrants from Nepal and poverty level among single mothers in the United States with a correlation coefficient (R) of 0.533 and weighted average of 27.9%, a difference of 28.3%.
Single Mother Poverty Correlation Summary
| Measurement | Seminole | Immigrants from Nepal |
| Minimum | 22.2% | 7.4% |
| Maximum | 82.4% | 66.7% |
| Range | 60.1% | 59.3% |
| Mean | 45.1% | 29.5% |
| Median | 43.4% | 27.9% |
| Interquartile 25% (IQ1) | 34.6% | 24.4% |
| Interquartile 75% (IQ3) | 56.2% | 33.7% |
| Interquartile Range (IQR) | 21.6% | 9.3% |
| Standard Deviation (Sample) | 13.9% | 10.3% |
| Standard Deviation (Population) | 13.8% | 10.2% |
Similar Demographics by Single Mother Poverty
Demographics Similar to Seminole by Single Mother Poverty
In terms of single mother poverty, the demographic groups most similar to Seminole are Ute (35.7%, a difference of 0.30%), Ottawa (35.5%, a difference of 0.78%), Kiowa (35.5%, a difference of 0.99%), Yakama (36.4%, a difference of 1.6%), and Choctaw (36.4%, a difference of 1.7%).
| Demographics | Rating | Rank | Single Mother Poverty |
| Chippewa | 0.0 /100 | #319 | Tragic 34.8% |
| Iroquois | 0.0 /100 | #320 | Tragic 34.8% |
| Paiute | 0.0 /100 | #321 | Tragic 35.1% |
| Blacks/African Americans | 0.0 /100 | #322 | Tragic 35.2% |
| Kiowa | 0.0 /100 | #323 | Tragic 35.5% |
| Ottawa | 0.0 /100 | #324 | Tragic 35.5% |
| Ute | 0.0 /100 | #325 | Tragic 35.7% |
| Seminole | 0.0 /100 | #326 | Tragic 35.8% |
| Yakama | 0.0 /100 | #327 | Tragic 36.4% |
| Choctaw | 0.0 /100 | #328 | Tragic 36.4% |
| Apache | 0.0 /100 | #329 | Tragic 36.6% |
| Natives/Alaskans | 0.0 /100 | #330 | Tragic 36.6% |
| Creek | 0.0 /100 | #331 | Tragic 36.7% |
| Dutch West Indians | 0.0 /100 | #332 | Tragic 36.8% |
| Menominee | 0.0 /100 | #333 | Tragic 37.1% |
Demographics Similar to Immigrants from Nepal by Single Mother Poverty
In terms of single mother poverty, the demographic groups most similar to Immigrants from Nepal are Immigrants from Brazil (27.9%, a difference of 0.010%), Immigrants from Netherlands (27.9%, a difference of 0.010%), Immigrants from Iraq (27.9%, a difference of 0.050%), Zimbabwean (27.9%, a difference of 0.060%), and Pakistani (28.0%, a difference of 0.12%).
| Demographics | Rating | Rank | Single Mother Poverty |
| Immigrants | Albania | 98.0 /100 | #91 | Exceptional 27.8% |
| Estonians | 97.9 /100 | #92 | Exceptional 27.8% |
| Romanians | 97.8 /100 | #93 | Exceptional 27.8% |
| Albanians | 97.6 /100 | #94 | Exceptional 27.9% |
| Chileans | 97.5 /100 | #95 | Exceptional 27.9% |
| Immigrants | Iraq | 97.3 /100 | #96 | Exceptional 27.9% |
| Immigrants | Brazil | 97.2 /100 | #97 | Exceptional 27.9% |
| Immigrants | Nepal | 97.2 /100 | #98 | Exceptional 27.9% |
| Immigrants | Netherlands | 97.2 /100 | #99 | Exceptional 27.9% |
| Zimbabweans | 97.1 /100 | #100 | Exceptional 27.9% |
| Pakistanis | 96.9 /100 | #101 | Exceptional 28.0% |
| Immigrants | Croatia | 96.7 /100 | #102 | Exceptional 28.0% |
| Immigrants | Northern Africa | 96.6 /100 | #103 | Exceptional 28.0% |
| Italians | 96.6 /100 | #104 | Exceptional 28.0% |
| Israelis | 96.5 /100 | #105 | Exceptional 28.0% |