Hopi vs Immigrants from Nepal Single Mother Poverty
COMPARE
Hopi
Immigrants from Nepal
Single Mother Poverty
Single Mother Poverty Comparison
Hopi
Immigrants from Nepal
34.5%
SINGLE MOTHER POVERTY
0.0/ 100
METRIC RATING
315th/ 347
METRIC RANK
27.9%
SINGLE MOTHER POVERTY
97.2/ 100
METRIC RATING
98th/ 347
METRIC RANK
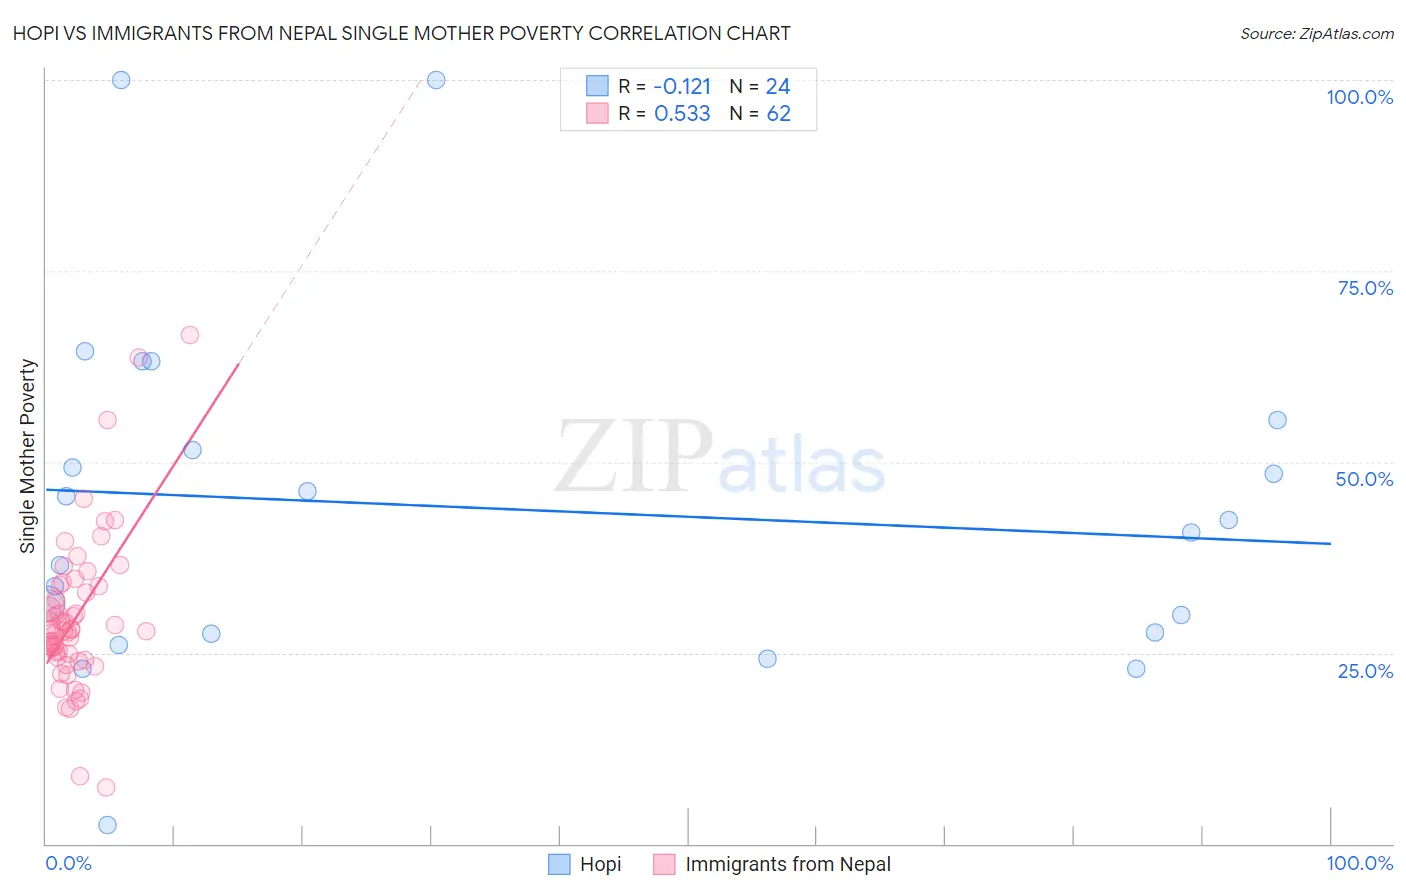
Hopi vs Immigrants from Nepal Single Mother Poverty Correlation Chart
The statistical analysis conducted on geographies consisting of 74,456,192 people shows a poor negative correlation between the proportion of Hopi and poverty level among single mothers in the United States with a correlation coefficient (R) of -0.121 and weighted average of 34.5%. Similarly, the statistical analysis conducted on geographies consisting of 184,396,639 people shows a substantial positive correlation between the proportion of Immigrants from Nepal and poverty level among single mothers in the United States with a correlation coefficient (R) of 0.533 and weighted average of 27.9%, a difference of 23.4%.
Single Mother Poverty Correlation Summary
| Measurement | Hopi | Immigrants from Nepal |
| Minimum | 2.5% | 7.4% |
| Maximum | 100.0% | 66.7% |
| Range | 97.5% | 59.3% |
| Mean | 44.0% | 29.5% |
| Median | 41.6% | 27.9% |
| Interquartile 25% (IQ1) | 27.6% | 24.4% |
| Interquartile 75% (IQ3) | 53.5% | 33.7% |
| Interquartile Range (IQR) | 26.0% | 9.3% |
| Standard Deviation (Sample) | 22.9% | 10.3% |
| Standard Deviation (Population) | 22.4% | 10.2% |
Similar Demographics by Single Mother Poverty
Demographics Similar to Hopi by Single Mother Poverty
In terms of single mother poverty, the demographic groups most similar to Hopi are Chickasaw (34.4%, a difference of 0.080%), Dominican (34.5%, a difference of 0.12%), Cherokee (34.5%, a difference of 0.22%), Immigrants from Dominican Republic (34.4%, a difference of 0.25%), and Central American Indian (34.3%, a difference of 0.34%).
| Demographics | Rating | Rank | Single Mother Poverty |
| Immigrants | Mexico | 0.0 /100 | #308 | Tragic 34.0% |
| Potawatomi | 0.0 /100 | #309 | Tragic 34.1% |
| Hondurans | 0.0 /100 | #310 | Tragic 34.2% |
| Alsatians | 0.0 /100 | #311 | Tragic 34.3% |
| Central American Indians | 0.0 /100 | #312 | Tragic 34.3% |
| Immigrants | Dominican Republic | 0.0 /100 | #313 | Tragic 34.4% |
| Chickasaw | 0.0 /100 | #314 | Tragic 34.4% |
| Hopi | 0.0 /100 | #315 | Tragic 34.5% |
| Dominicans | 0.0 /100 | #316 | Tragic 34.5% |
| Cherokee | 0.0 /100 | #317 | Tragic 34.5% |
| Immigrants | Honduras | 0.0 /100 | #318 | Tragic 34.7% |
| Chippewa | 0.0 /100 | #319 | Tragic 34.8% |
| Iroquois | 0.0 /100 | #320 | Tragic 34.8% |
| Paiute | 0.0 /100 | #321 | Tragic 35.1% |
| Blacks/African Americans | 0.0 /100 | #322 | Tragic 35.2% |
Demographics Similar to Immigrants from Nepal by Single Mother Poverty
In terms of single mother poverty, the demographic groups most similar to Immigrants from Nepal are Immigrants from Brazil (27.9%, a difference of 0.010%), Immigrants from Netherlands (27.9%, a difference of 0.010%), Immigrants from Iraq (27.9%, a difference of 0.050%), Zimbabwean (27.9%, a difference of 0.060%), and Pakistani (28.0%, a difference of 0.12%).
| Demographics | Rating | Rank | Single Mother Poverty |
| Immigrants | Albania | 98.0 /100 | #91 | Exceptional 27.8% |
| Estonians | 97.9 /100 | #92 | Exceptional 27.8% |
| Romanians | 97.8 /100 | #93 | Exceptional 27.8% |
| Albanians | 97.6 /100 | #94 | Exceptional 27.9% |
| Chileans | 97.5 /100 | #95 | Exceptional 27.9% |
| Immigrants | Iraq | 97.3 /100 | #96 | Exceptional 27.9% |
| Immigrants | Brazil | 97.2 /100 | #97 | Exceptional 27.9% |
| Immigrants | Nepal | 97.2 /100 | #98 | Exceptional 27.9% |
| Immigrants | Netherlands | 97.2 /100 | #99 | Exceptional 27.9% |
| Zimbabweans | 97.1 /100 | #100 | Exceptional 27.9% |
| Pakistanis | 96.9 /100 | #101 | Exceptional 28.0% |
| Immigrants | Croatia | 96.7 /100 | #102 | Exceptional 28.0% |
| Immigrants | Northern Africa | 96.6 /100 | #103 | Exceptional 28.0% |
| Italians | 96.6 /100 | #104 | Exceptional 28.0% |
| Israelis | 96.5 /100 | #105 | Exceptional 28.0% |