Osage vs Central American Single Mother Poverty
COMPARE
Osage
Central American
Single Mother Poverty
Single Mother Poverty Comparison
Osage
Central Americans
32.6%
SINGLE MOTHER POVERTY
0.0/ 100
METRIC RATING
290th/ 347
METRIC RANK
31.8%
SINGLE MOTHER POVERTY
0.1/ 100
METRIC RATING
275th/ 347
METRIC RANK
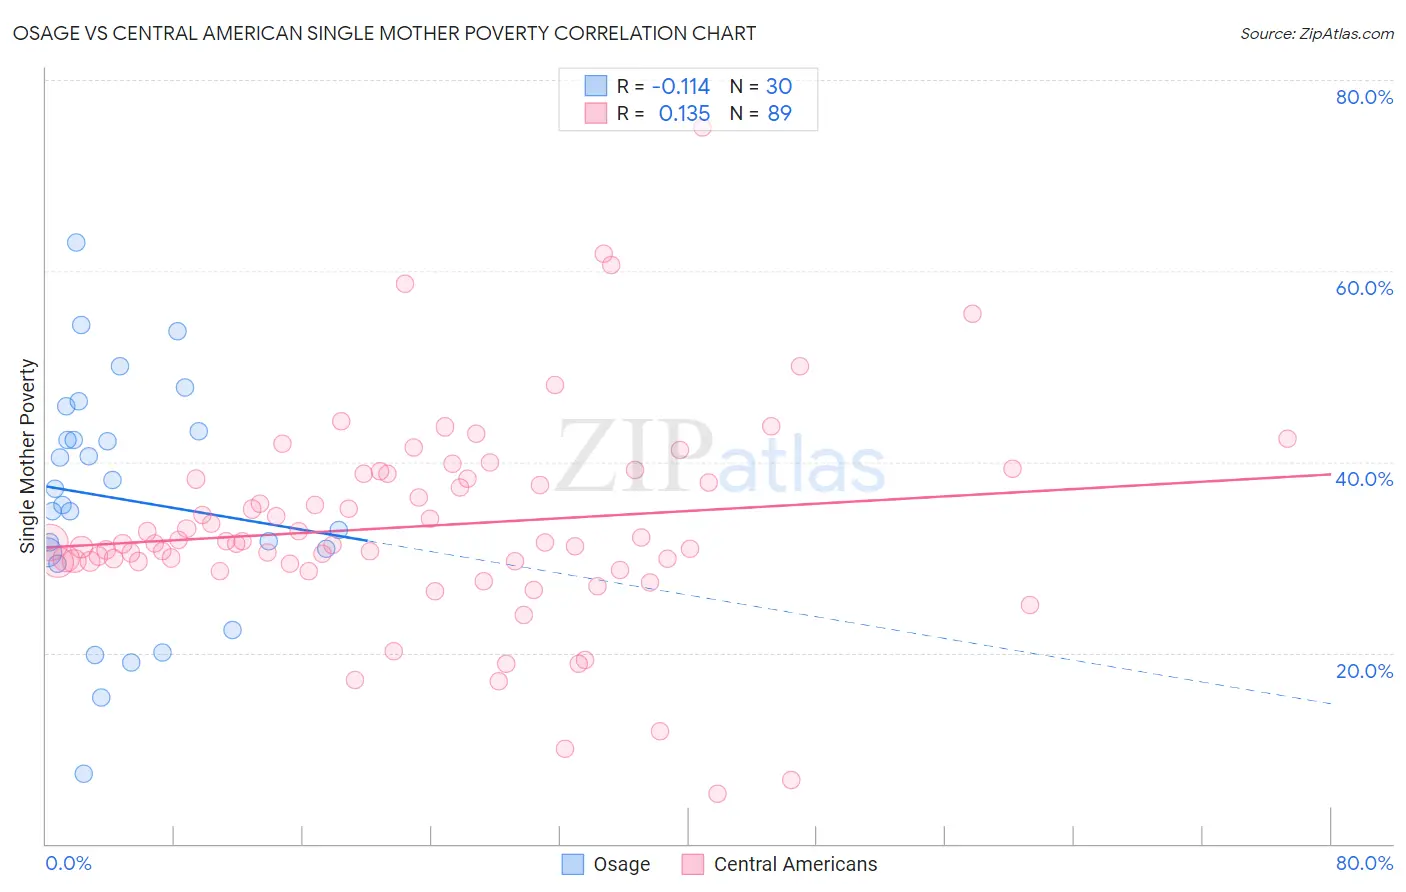
Osage vs Central American Single Mother Poverty Correlation Chart
The statistical analysis conducted on geographies consisting of 91,278,807 people shows a poor negative correlation between the proportion of Osage and poverty level among single mothers in the United States with a correlation coefficient (R) of -0.114 and weighted average of 32.6%. Similarly, the statistical analysis conducted on geographies consisting of 489,410,238 people shows a poor positive correlation between the proportion of Central Americans and poverty level among single mothers in the United States with a correlation coefficient (R) of 0.135 and weighted average of 31.8%, a difference of 2.6%.
Single Mother Poverty Correlation Summary
| Measurement | Osage | Central American |
| Minimum | 7.3% | 5.3% |
| Maximum | 63.0% | 75.0% |
| Range | 55.7% | 69.8% |
| Mean | 36.1% | 33.3% |
| Median | 36.3% | 31.5% |
| Interquartile 25% (IQ1) | 30.5% | 29.5% |
| Interquartile 75% (IQ3) | 43.2% | 38.5% |
| Interquartile Range (IQR) | 12.7% | 8.9% |
| Standard Deviation (Sample) | 12.5% | 10.9% |
| Standard Deviation (Population) | 12.3% | 10.9% |
Demographics Similar to Osage and Central Americans by Single Mother Poverty
In terms of single mother poverty, the demographic groups most similar to Osage are U.S. Virgin Islander (32.6%, a difference of 0.11%), Somali (32.6%, a difference of 0.14%), Immigrants from Dominica (32.5%, a difference of 0.37%), Yup'ik (32.5%, a difference of 0.49%), and Immigrants from Latin America (32.4%, a difference of 0.57%). Similarly, the demographic groups most similar to Central Americans are Delaware (31.8%, a difference of 0.16%), Bangladeshi (31.7%, a difference of 0.19%), Mexican American Indian (31.9%, a difference of 0.37%), Fijian (31.6%, a difference of 0.42%), and Immigrants from Zaire (32.0%, a difference of 0.60%).
| Demographics | Rating | Rank | Single Mother Poverty |
| Immigrants | Micronesia | 0.1 /100 | #272 | Tragic 31.6% |
| Fijians | 0.1 /100 | #273 | Tragic 31.6% |
| Bangladeshis | 0.1 /100 | #274 | Tragic 31.7% |
| Central Americans | 0.1 /100 | #275 | Tragic 31.8% |
| Delaware | 0.0 /100 | #276 | Tragic 31.8% |
| Mexican American Indians | 0.0 /100 | #277 | Tragic 31.9% |
| Immigrants | Zaire | 0.0 /100 | #278 | Tragic 32.0% |
| Marshallese | 0.0 /100 | #279 | Tragic 32.1% |
| Immigrants | Nonimmigrants | 0.0 /100 | #280 | Tragic 32.2% |
| Cree | 0.0 /100 | #281 | Tragic 32.2% |
| Immigrants | Azores | 0.0 /100 | #282 | Tragic 32.2% |
| Spanish Americans | 0.0 /100 | #283 | Tragic 32.3% |
| Indonesians | 0.0 /100 | #284 | Tragic 32.4% |
| Immigrants | Latin America | 0.0 /100 | #285 | Tragic 32.4% |
| Yup'ik | 0.0 /100 | #286 | Tragic 32.5% |
| Immigrants | Dominica | 0.0 /100 | #287 | Tragic 32.5% |
| Somalis | 0.0 /100 | #288 | Tragic 32.6% |
| U.S. Virgin Islanders | 0.0 /100 | #289 | Tragic 32.6% |
| Osage | 0.0 /100 | #290 | Tragic 32.6% |
| Guatemalans | 0.0 /100 | #291 | Tragic 32.9% |
| Shoshone | 0.0 /100 | #292 | Tragic 32.9% |