Icelander vs Central American Single Mother Poverty
COMPARE
Icelander
Central American
Single Mother Poverty
Single Mother Poverty Comparison
Icelanders
Central Americans
29.5%
SINGLE MOTHER POVERTY
26.1/ 100
METRIC RATING
194th/ 347
METRIC RANK
31.8%
SINGLE MOTHER POVERTY
0.1/ 100
METRIC RATING
275th/ 347
METRIC RANK
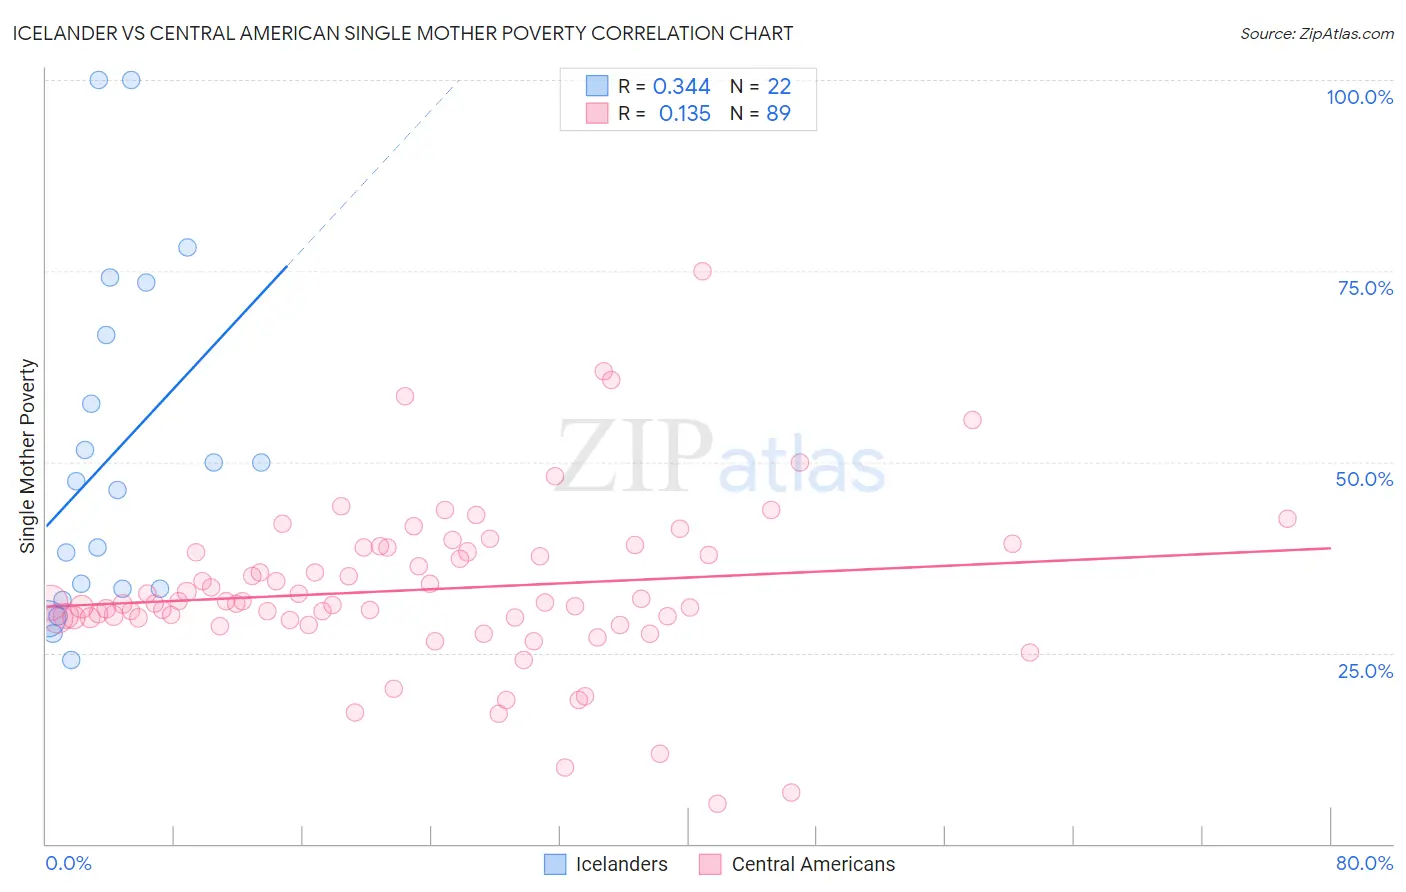
Icelander vs Central American Single Mother Poverty Correlation Chart
The statistical analysis conducted on geographies consisting of 157,541,797 people shows a mild positive correlation between the proportion of Icelanders and poverty level among single mothers in the United States with a correlation coefficient (R) of 0.344 and weighted average of 29.5%. Similarly, the statistical analysis conducted on geographies consisting of 489,410,238 people shows a poor positive correlation between the proportion of Central Americans and poverty level among single mothers in the United States with a correlation coefficient (R) of 0.135 and weighted average of 31.8%, a difference of 7.6%.
Single Mother Poverty Correlation Summary
| Measurement | Icelander | Central American |
| Minimum | 24.1% | 5.3% |
| Maximum | 100.0% | 75.0% |
| Range | 75.9% | 69.8% |
| Mean | 50.7% | 33.3% |
| Median | 46.9% | 31.5% |
| Interquartile 25% (IQ1) | 33.3% | 29.5% |
| Interquartile 75% (IQ3) | 66.7% | 38.5% |
| Interquartile Range (IQR) | 33.3% | 8.9% |
| Standard Deviation (Sample) | 22.6% | 10.9% |
| Standard Deviation (Population) | 22.0% | 10.9% |
Similar Demographics by Single Mother Poverty
Demographics Similar to Icelanders by Single Mother Poverty
In terms of single mother poverty, the demographic groups most similar to Icelanders are Slavic (29.6%, a difference of 0.10%), Basque (29.5%, a difference of 0.13%), Moroccan (29.5%, a difference of 0.15%), Spanish American Indian (29.6%, a difference of 0.17%), and Immigrants from Trinidad and Tobago (29.5%, a difference of 0.19%).
| Demographics | Rating | Rank | Single Mother Poverty |
| Lebanese | 32.5 /100 | #187 | Fair 29.4% |
| Guamanians/Chamorros | 31.8 /100 | #188 | Fair 29.4% |
| Immigrants | Africa | 31.6 /100 | #189 | Fair 29.4% |
| Immigrants | Germany | 30.4 /100 | #190 | Fair 29.5% |
| Immigrants | Trinidad and Tobago | 29.2 /100 | #191 | Fair 29.5% |
| Moroccans | 28.6 /100 | #192 | Fair 29.5% |
| Basques | 28.3 /100 | #193 | Fair 29.5% |
| Icelanders | 26.1 /100 | #194 | Fair 29.5% |
| Slavs | 24.5 /100 | #195 | Fair 29.6% |
| Spanish American Indians | 23.4 /100 | #196 | Fair 29.6% |
| Immigrants | Jamaica | 22.0 /100 | #197 | Fair 29.6% |
| Trinidadians and Tobagonians | 21.7 /100 | #198 | Fair 29.6% |
| Cubans | 20.8 /100 | #199 | Fair 29.6% |
| Panamanians | 20.0 /100 | #200 | Fair 29.6% |
| Belgians | 18.8 /100 | #201 | Poor 29.7% |
Demographics Similar to Central Americans by Single Mother Poverty
In terms of single mother poverty, the demographic groups most similar to Central Americans are Delaware (31.8%, a difference of 0.16%), Bangladeshi (31.7%, a difference of 0.19%), Mexican American Indian (31.9%, a difference of 0.37%), Fijian (31.6%, a difference of 0.42%), and Immigrants from Zaire (32.0%, a difference of 0.60%).
| Demographics | Rating | Rank | Single Mother Poverty |
| Immigrants | Senegal | 0.1 /100 | #268 | Tragic 31.5% |
| Scotch-Irish | 0.1 /100 | #269 | Tragic 31.5% |
| British West Indians | 0.1 /100 | #270 | Tragic 31.5% |
| Immigrants | Cabo Verde | 0.1 /100 | #271 | Tragic 31.6% |
| Immigrants | Micronesia | 0.1 /100 | #272 | Tragic 31.6% |
| Fijians | 0.1 /100 | #273 | Tragic 31.6% |
| Bangladeshis | 0.1 /100 | #274 | Tragic 31.7% |
| Central Americans | 0.1 /100 | #275 | Tragic 31.8% |
| Delaware | 0.0 /100 | #276 | Tragic 31.8% |
| Mexican American Indians | 0.0 /100 | #277 | Tragic 31.9% |
| Immigrants | Zaire | 0.0 /100 | #278 | Tragic 32.0% |
| Marshallese | 0.0 /100 | #279 | Tragic 32.1% |
| Immigrants | Nonimmigrants | 0.0 /100 | #280 | Tragic 32.2% |
| Cree | 0.0 /100 | #281 | Tragic 32.2% |
| Immigrants | Azores | 0.0 /100 | #282 | Tragic 32.2% |