Hopi vs Immigrants from Chile 1 or more Vehicles in Household
COMPARE
Hopi
Immigrants from Chile
1 or more Vehicles in Household
1 or more Vehicles in Household Comparison
Hopi
Immigrants from Chile
86.4%
1 OR MORE VEHICLES IN HOUSEHOLD
0.0/ 100
METRIC RATING
288th/ 347
METRIC RANK
89.1%
1 OR MORE VEHICLES IN HOUSEHOLD
14.4/ 100
METRIC RATING
208th/ 347
METRIC RANK
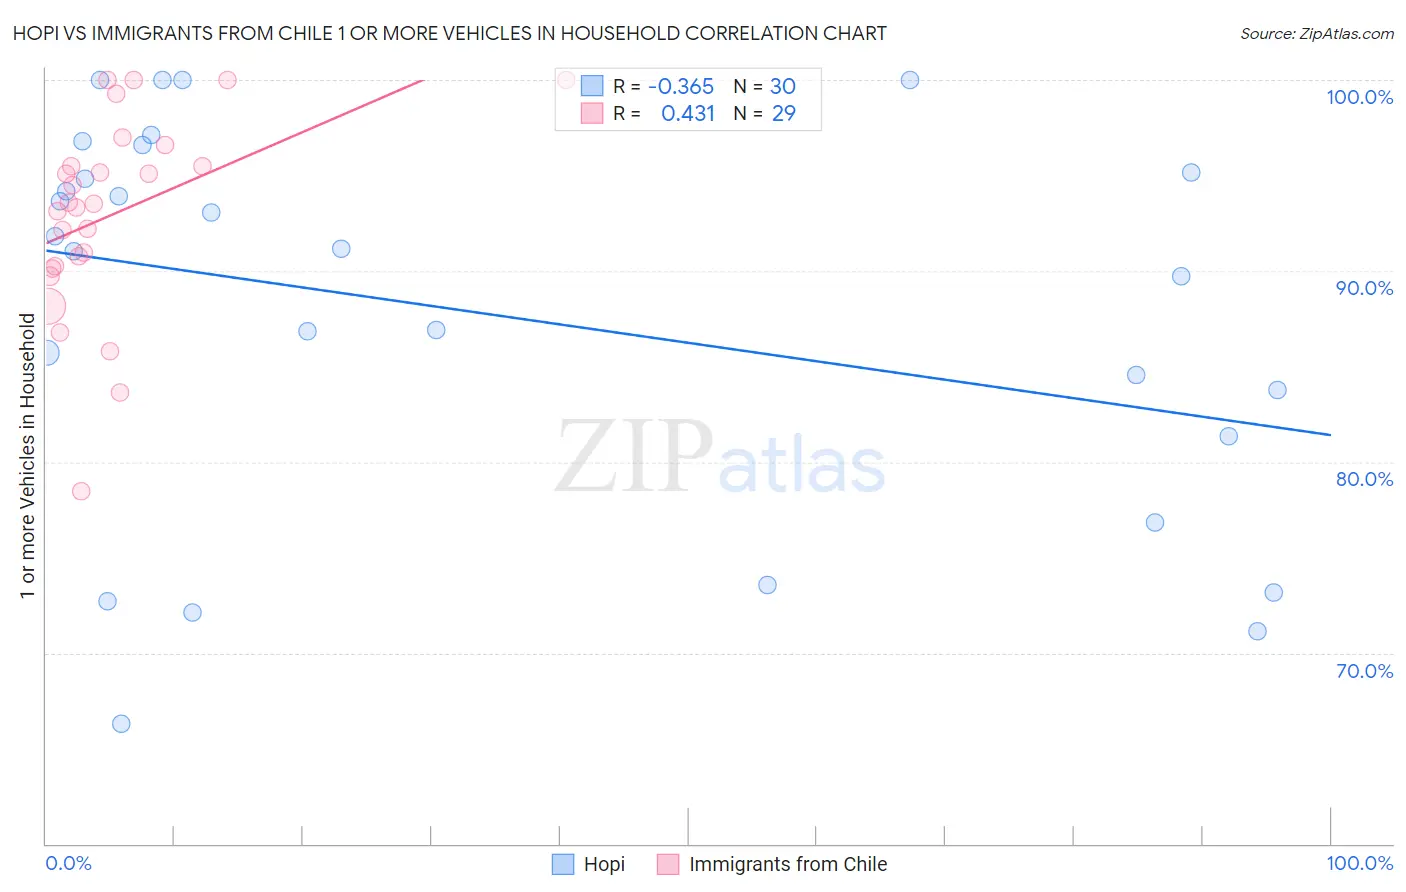
Hopi vs Immigrants from Chile 1 or more Vehicles in Household Correlation Chart
The statistical analysis conducted on geographies consisting of 74,733,532 people shows a mild negative correlation between the proportion of Hopi and percentage of households with 1 or more vehicles available in the United States with a correlation coefficient (R) of -0.365 and weighted average of 86.4%. Similarly, the statistical analysis conducted on geographies consisting of 218,611,230 people shows a moderate positive correlation between the proportion of Immigrants from Chile and percentage of households with 1 or more vehicles available in the United States with a correlation coefficient (R) of 0.431 and weighted average of 89.1%, a difference of 3.1%.
1 or more Vehicles in Household Correlation Summary
| Measurement | Hopi | Immigrants from Chile |
| Minimum | 66.3% | 78.5% |
| Maximum | 100.0% | 100.0% |
| Range | 33.7% | 21.5% |
| Mean | 87.8% | 93.0% |
| Median | 91.1% | 93.5% |
| Interquartile 25% (IQ1) | 81.3% | 90.2% |
| Interquartile 75% (IQ3) | 95.2% | 96.0% |
| Interquartile Range (IQR) | 13.9% | 5.9% |
| Standard Deviation (Sample) | 10.1% | 5.2% |
| Standard Deviation (Population) | 9.9% | 5.1% |
Similar Demographics by 1 or more Vehicles in Household
Demographics Similar to Hopi by 1 or more Vehicles in Household
In terms of 1 or more vehicles in household, the demographic groups most similar to Hopi are Immigrants from Ireland (86.4%, a difference of 0.020%), Immigrants from Australia (86.4%, a difference of 0.060%), Immigrants from Malaysia (86.5%, a difference of 0.070%), Pima (86.3%, a difference of 0.14%), and Immigrants from Eastern Asia (86.5%, a difference of 0.15%).
| Demographics | Rating | Rank | 1 or more Vehicles in Household |
| Mongolians | 0.0 /100 | #281 | Tragic 87.0% |
| Colville | 0.0 /100 | #282 | Tragic 86.8% |
| Immigrants | Eastern Europe | 0.0 /100 | #283 | Tragic 86.7% |
| Central American Indians | 0.0 /100 | #284 | Tragic 86.7% |
| Immigrants | Kazakhstan | 0.0 /100 | #285 | Tragic 86.6% |
| Immigrants | Eastern Asia | 0.0 /100 | #286 | Tragic 86.5% |
| Immigrants | Malaysia | 0.0 /100 | #287 | Tragic 86.5% |
| Hopi | 0.0 /100 | #288 | Tragic 86.4% |
| Immigrants | Ireland | 0.0 /100 | #289 | Tragic 86.4% |
| Immigrants | Australia | 0.0 /100 | #290 | Tragic 86.4% |
| Pima | 0.0 /100 | #291 | Tragic 86.3% |
| Okinawans | 0.0 /100 | #292 | Tragic 86.1% |
| Indians (Asian) | 0.0 /100 | #293 | Tragic 86.0% |
| Alaskan Athabascans | 0.0 /100 | #294 | Tragic 86.0% |
| Immigrants | Jamaica | 0.0 /100 | #295 | Tragic 85.8% |
Demographics Similar to Immigrants from Chile by 1 or more Vehicles in Household
In terms of 1 or more vehicles in household, the demographic groups most similar to Immigrants from Chile are Immigrants from Denmark (89.1%, a difference of 0.010%), Immigrants from Italy (89.1%, a difference of 0.010%), Dutch West Indian (89.0%, a difference of 0.030%), Apache (89.1%, a difference of 0.050%), and Sierra Leonean (89.0%, a difference of 0.050%).
| Demographics | Rating | Rank | 1 or more Vehicles in Household |
| Immigrants | Western Europe | 20.5 /100 | #201 | Fair 89.2% |
| Iroquois | 19.8 /100 | #202 | Poor 89.2% |
| Cambodians | 18.9 /100 | #203 | Poor 89.2% |
| Romanians | 18.2 /100 | #204 | Poor 89.2% |
| Guatemalans | 17.8 /100 | #205 | Poor 89.2% |
| Apache | 16.2 /100 | #206 | Poor 89.1% |
| Immigrants | Denmark | 14.8 /100 | #207 | Poor 89.1% |
| Immigrants | Chile | 14.4 /100 | #208 | Poor 89.1% |
| Immigrants | Italy | 14.0 /100 | #209 | Poor 89.1% |
| Dutch West Indians | 13.5 /100 | #210 | Poor 89.0% |
| Sierra Leoneans | 13.0 /100 | #211 | Poor 89.0% |
| Somalis | 12.8 /100 | #212 | Poor 89.0% |
| Immigrants | Western Asia | 12.3 /100 | #213 | Poor 89.0% |
| Immigrants | Hungary | 11.9 /100 | #214 | Poor 89.0% |
| Immigrants | Sri Lanka | 10.2 /100 | #215 | Poor 88.9% |