Hopi vs Immigrants from Chile No Schooling Completed
COMPARE
Hopi
Immigrants from Chile
No Schooling Completed
No Schooling Completed Comparison
Hopi
Immigrants from Chile
2.2%
NO SCHOOLING COMPLETED
12.9/ 100
METRIC RATING
204th/ 347
METRIC RANK
2.2%
NO SCHOOLING COMPLETED
22.7/ 100
METRIC RATING
198th/ 347
METRIC RANK
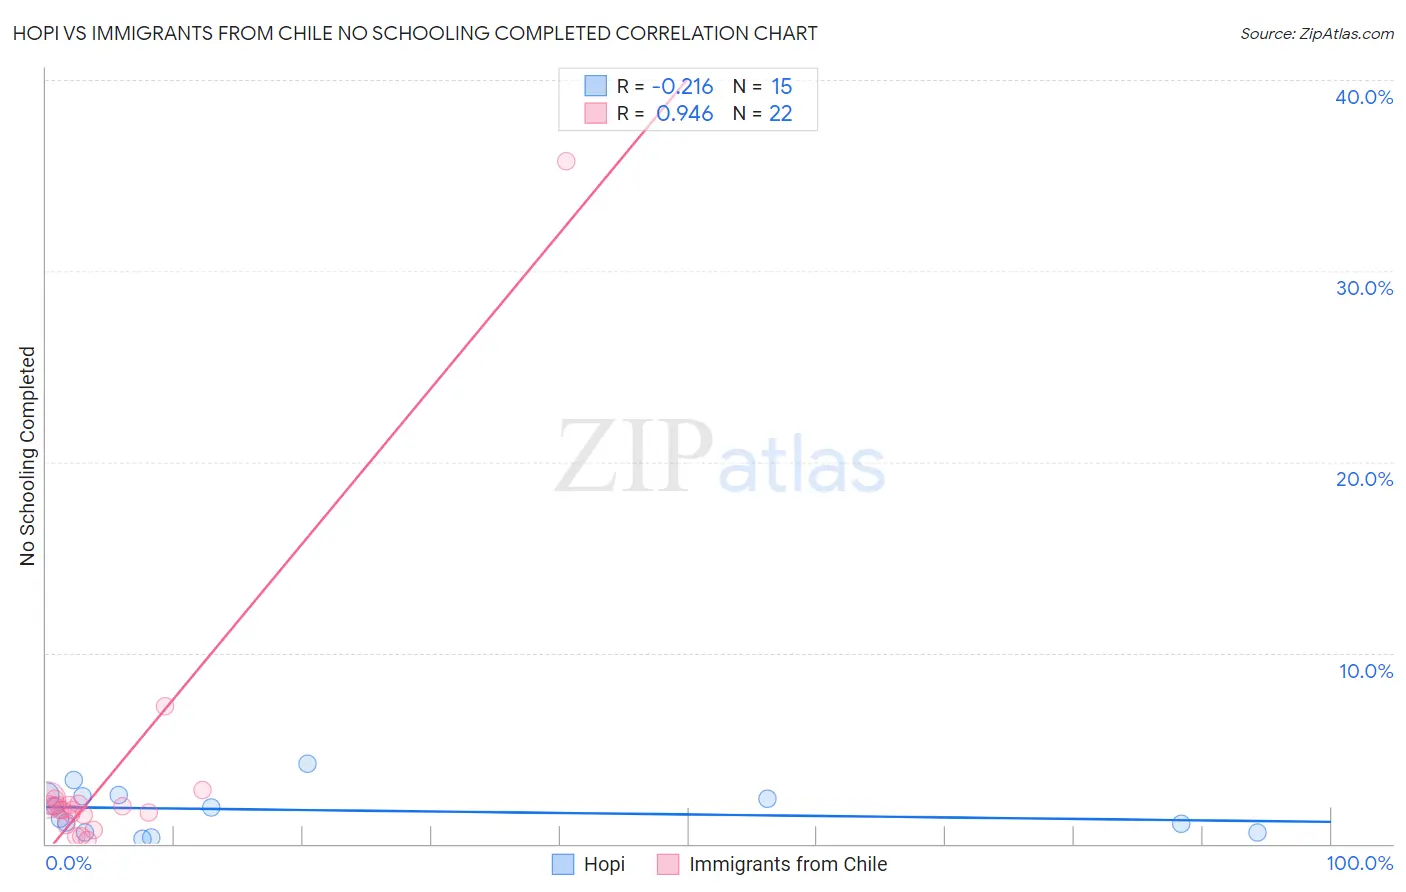
Hopi vs Immigrants from Chile No Schooling Completed Correlation Chart
The statistical analysis conducted on geographies consisting of 74,568,063 people shows a weak negative correlation between the proportion of Hopi and percentage of population with no schooling in the United States with a correlation coefficient (R) of -0.216 and weighted average of 2.2%. Similarly, the statistical analysis conducted on geographies consisting of 217,752,126 people shows a near-perfect positive correlation between the proportion of Immigrants from Chile and percentage of population with no schooling in the United States with a correlation coefficient (R) of 0.946 and weighted average of 2.2%, a difference of 2.2%.
No Schooling Completed Correlation Summary
| Measurement | Hopi | Immigrants from Chile |
| Minimum | 0.29% | 0.21% |
| Maximum | 4.2% | 35.7% |
| Range | 3.9% | 35.5% |
| Mean | 1.8% | 3.4% |
| Median | 1.9% | 1.9% |
| Interquartile 25% (IQ1) | 0.57% | 1.5% |
| Interquartile 75% (IQ3) | 2.5% | 2.1% |
| Interquartile Range (IQR) | 2.0% | 0.53% |
| Standard Deviation (Sample) | 1.2% | 7.3% |
| Standard Deviation (Population) | 1.1% | 7.2% |
Demographics Similar to Hopi and Immigrants from Chile by No Schooling Completed
In terms of no schooling completed, the demographic groups most similar to Hopi are Laotian (2.2%, a difference of 0.11%), Moroccan (2.2%, a difference of 0.22%), Immigrants from Bahamas (2.2%, a difference of 0.40%), Bahamian (2.2%, a difference of 0.41%), and South American Indian (2.2%, a difference of 0.59%). Similarly, the demographic groups most similar to Immigrants from Chile are African (2.2%, a difference of 0.17%), Immigrants from Southern Europe (2.2%, a difference of 0.18%), Immigrants from Ukraine (2.2%, a difference of 0.60%), Immigrants from Northern Africa (2.2%, a difference of 0.64%), and Hawaiian (2.2%, a difference of 0.75%).
| Demographics | Rating | Rank | No Schooling Completed |
| Bermudans | 30.7 /100 | #191 | Fair 2.1% |
| Guamanians/Chamorros | 29.8 /100 | #192 | Fair 2.2% |
| Paraguayans | 29.3 /100 | #193 | Fair 2.2% |
| Immigrants | Albania | 28.3 /100 | #194 | Fair 2.2% |
| Hawaiians | 27.0 /100 | #195 | Fair 2.2% |
| Immigrants | Ukraine | 26.1 /100 | #196 | Fair 2.2% |
| Immigrants | Southern Europe | 23.8 /100 | #197 | Fair 2.2% |
| Immigrants | Chile | 22.7 /100 | #198 | Fair 2.2% |
| Africans | 21.8 /100 | #199 | Fair 2.2% |
| Immigrants | Northern Africa | 19.5 /100 | #200 | Poor 2.2% |
| Costa Ricans | 17.1 /100 | #201 | Poor 2.2% |
| Moroccans | 13.7 /100 | #202 | Poor 2.2% |
| Laotians | 13.3 /100 | #203 | Poor 2.2% |
| Hopi | 12.9 /100 | #204 | Poor 2.2% |
| Immigrants | Bahamas | 11.6 /100 | #205 | Poor 2.2% |
| Bahamians | 11.6 /100 | #206 | Poor 2.2% |
| South American Indians | 11.0 /100 | #207 | Poor 2.2% |
| Uruguayans | 11.0 /100 | #208 | Poor 2.2% |
| Immigrants | Oceania | 10.2 /100 | #209 | Poor 2.2% |
| Natives/Alaskans | 10.0 /100 | #210 | Tragic 2.2% |
| Immigrants | Panama | 8.8 /100 | #211 | Tragic 2.3% |