Guatemalan vs Immigrants from Latvia Bachelor's Degree
COMPARE
Guatemalan
Immigrants from Latvia
Bachelor's Degree
Bachelor's Degree Comparison
Guatemalans
Immigrants from Latvia
31.0%
BACHELOR'S DEGREE
0.1/ 100
METRIC RATING
288th/ 347
METRIC RANK
45.1%
BACHELOR'S DEGREE
100.0/ 100
METRIC RATING
39th/ 347
METRIC RANK
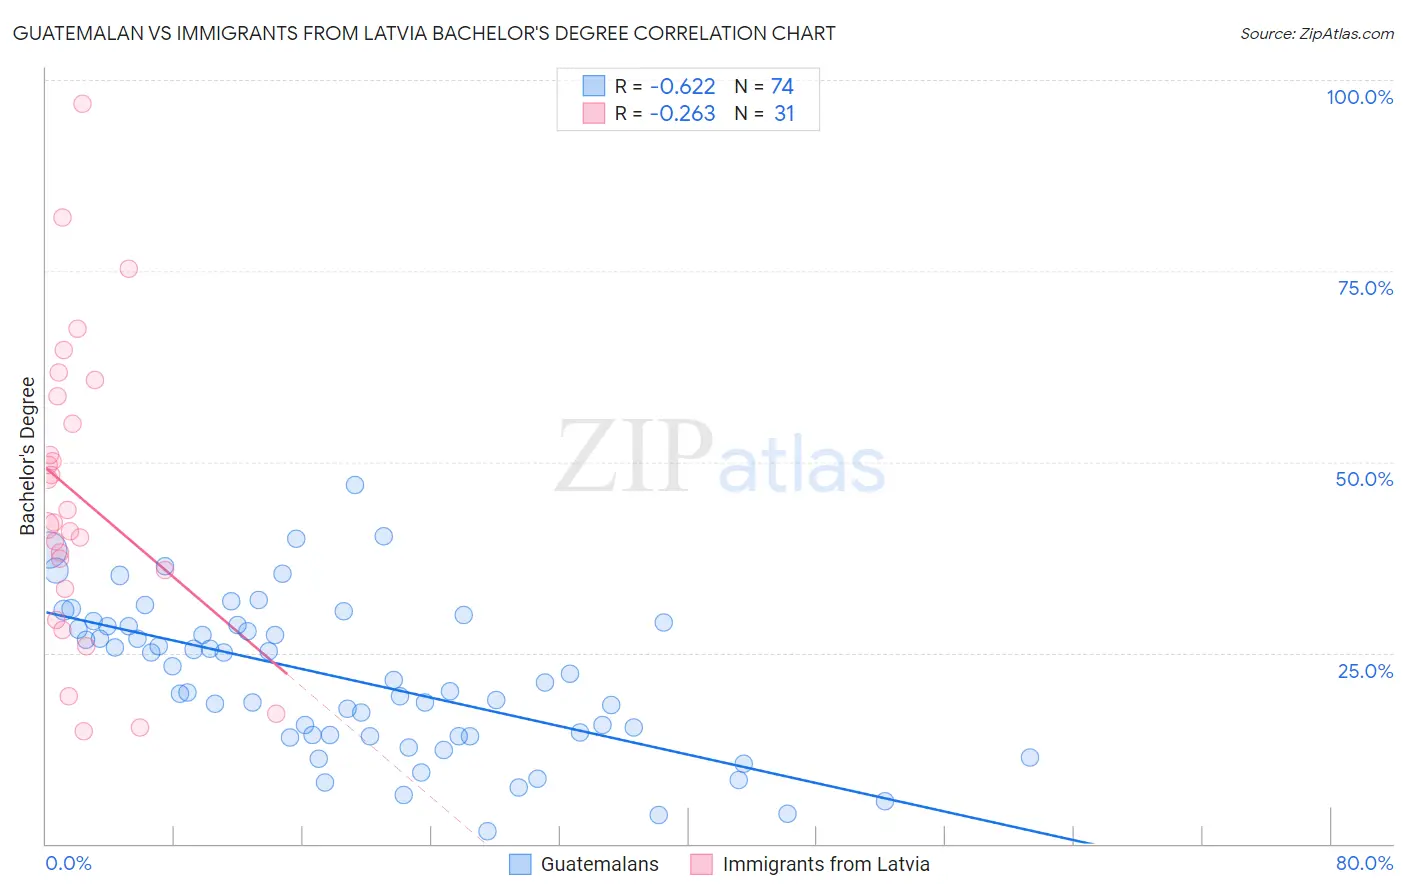
Guatemalan vs Immigrants from Latvia Bachelor's Degree Correlation Chart
The statistical analysis conducted on geographies consisting of 409,514,528 people shows a significant negative correlation between the proportion of Guatemalans and percentage of population with at least bachelor's degree education in the United States with a correlation coefficient (R) of -0.622 and weighted average of 31.0%. Similarly, the statistical analysis conducted on geographies consisting of 113,735,345 people shows a weak negative correlation between the proportion of Immigrants from Latvia and percentage of population with at least bachelor's degree education in the United States with a correlation coefficient (R) of -0.263 and weighted average of 45.1%, a difference of 45.7%.
Bachelor's Degree Correlation Summary
| Measurement | Guatemalan | Immigrants from Latvia |
| Minimum | 1.7% | 14.7% |
| Maximum | 47.0% | 96.9% |
| Range | 45.3% | 82.2% |
| Mean | 21.6% | 45.5% |
| Median | 21.3% | 42.0% |
| Interquartile 25% (IQ1) | 14.1% | 33.3% |
| Interquartile 75% (IQ3) | 28.5% | 58.6% |
| Interquartile Range (IQR) | 14.3% | 25.3% |
| Standard Deviation (Sample) | 9.9% | 19.4% |
| Standard Deviation (Population) | 9.8% | 19.1% |
Similar Demographics by Bachelor's Degree
Demographics Similar to Guatemalans by Bachelor's Degree
In terms of bachelor's degree, the demographic groups most similar to Guatemalans are Puerto Rican (31.0%, a difference of 0.14%), Immigrants from Honduras (30.9%, a difference of 0.18%), Black/African American (30.9%, a difference of 0.22%), Ute (30.9%, a difference of 0.30%), and Ottawa (31.1%, a difference of 0.36%).
| Demographics | Rating | Rank | Bachelor's Degree |
| Blackfeet | 0.1 /100 | #281 | Tragic 31.5% |
| Immigrants | Caribbean | 0.1 /100 | #282 | Tragic 31.4% |
| Hondurans | 0.1 /100 | #283 | Tragic 31.3% |
| Haitians | 0.1 /100 | #284 | Tragic 31.3% |
| Aleuts | 0.1 /100 | #285 | Tragic 31.3% |
| Immigrants | El Salvador | 0.1 /100 | #286 | Tragic 31.3% |
| Ottawa | 0.1 /100 | #287 | Tragic 31.1% |
| Guatemalans | 0.1 /100 | #288 | Tragic 31.0% |
| Puerto Ricans | 0.1 /100 | #289 | Tragic 31.0% |
| Immigrants | Honduras | 0.1 /100 | #290 | Tragic 30.9% |
| Blacks/African Americans | 0.1 /100 | #291 | Tragic 30.9% |
| Ute | 0.1 /100 | #292 | Tragic 30.9% |
| Cape Verdeans | 0.1 /100 | #293 | Tragic 30.9% |
| Immigrants | Guatemala | 0.0 /100 | #294 | Tragic 30.8% |
| Immigrants | Dominican Republic | 0.0 /100 | #295 | Tragic 30.7% |
Demographics Similar to Immigrants from Latvia by Bachelor's Degree
In terms of bachelor's degree, the demographic groups most similar to Immigrants from Latvia are Immigrants from Belarus (45.0%, a difference of 0.27%), Immigrants from Malaysia (45.0%, a difference of 0.31%), Bulgarian (45.3%, a difference of 0.33%), Russian (45.3%, a difference of 0.42%), and Mongolian (45.4%, a difference of 0.57%).
| Demographics | Rating | Rank | Bachelor's Degree |
| Immigrants | Turkey | 100.0 /100 | #32 | Exceptional 46.0% |
| Immigrants | Northern Europe | 100.0 /100 | #33 | Exceptional 45.6% |
| Immigrants | Denmark | 100.0 /100 | #34 | Exceptional 45.4% |
| Immigrants | Russia | 100.0 /100 | #35 | Exceptional 45.4% |
| Mongolians | 100.0 /100 | #36 | Exceptional 45.4% |
| Russians | 100.0 /100 | #37 | Exceptional 45.3% |
| Bulgarians | 100.0 /100 | #38 | Exceptional 45.3% |
| Immigrants | Latvia | 100.0 /100 | #39 | Exceptional 45.1% |
| Immigrants | Belarus | 100.0 /100 | #40 | Exceptional 45.0% |
| Immigrants | Malaysia | 100.0 /100 | #41 | Exceptional 45.0% |
| Immigrants | Saudi Arabia | 100.0 /100 | #42 | Exceptional 44.8% |
| Immigrants | South Africa | 99.9 /100 | #43 | Exceptional 44.8% |
| Immigrants | Lithuania | 99.9 /100 | #44 | Exceptional 44.6% |
| Immigrants | Kuwait | 99.9 /100 | #45 | Exceptional 44.6% |
| Immigrants | Bulgaria | 99.9 /100 | #46 | Exceptional 44.6% |