Ethiopian vs Shoshone Family Poverty
COMPARE
Ethiopian
Shoshone
Family Poverty
Family Poverty Comparison
Ethiopians
Shoshone
8.8%
FAMILY POVERTY
66.3/ 100
METRIC RATING
162nd/ 347
METRIC RANK
10.9%
FAMILY POVERTY
0.2/ 100
METRIC RATING
261st/ 347
METRIC RANK
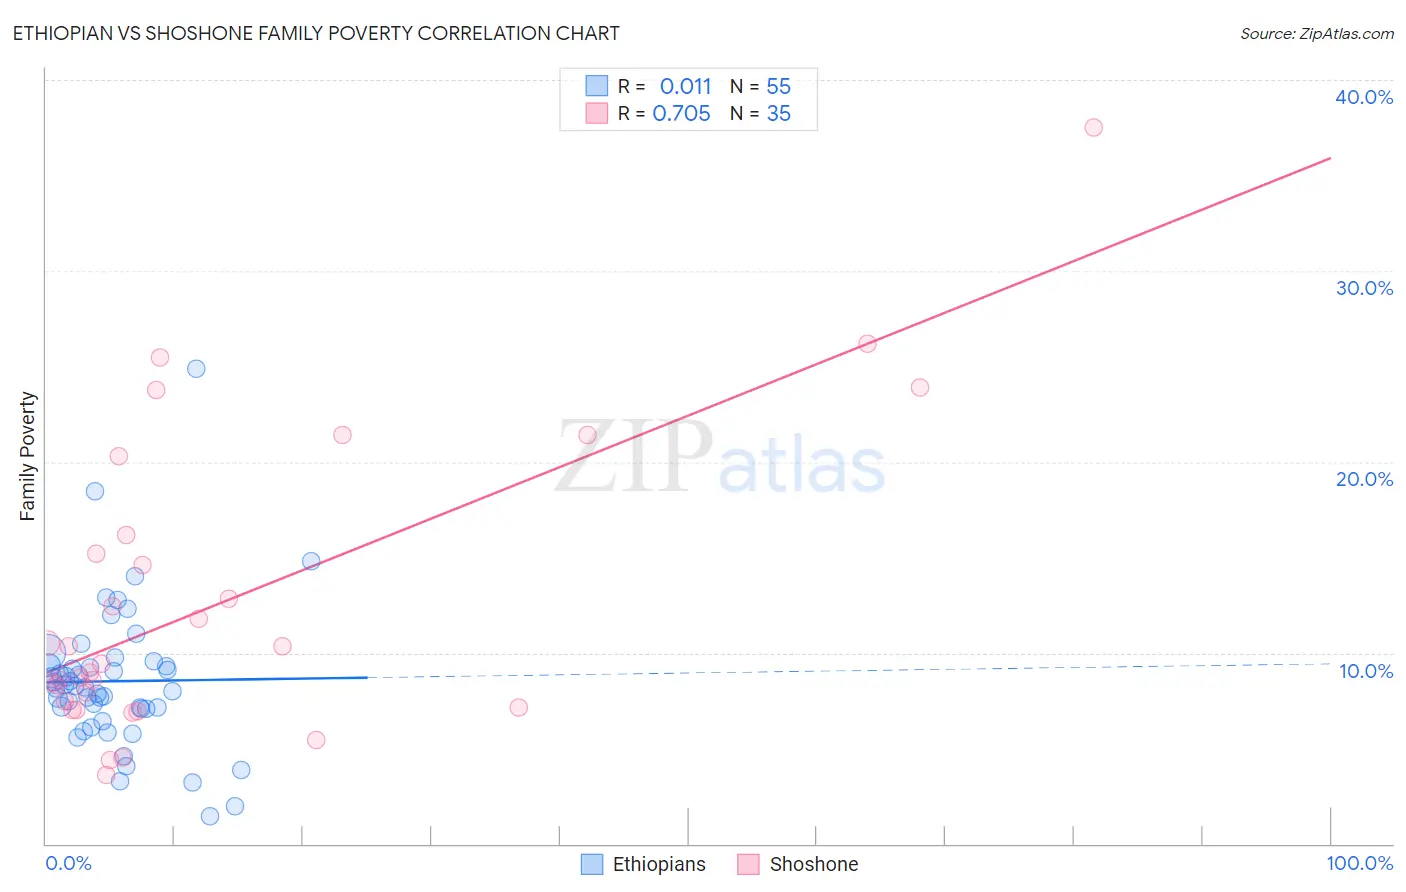
Ethiopian vs Shoshone Family Poverty Correlation Chart
The statistical analysis conducted on geographies consisting of 222,923,037 people shows no correlation between the proportion of Ethiopians and poverty level among families in the United States with a correlation coefficient (R) of 0.011 and weighted average of 8.8%. Similarly, the statistical analysis conducted on geographies consisting of 66,600,445 people shows a strong positive correlation between the proportion of Shoshone and poverty level among families in the United States with a correlation coefficient (R) of 0.705 and weighted average of 10.9%, a difference of 23.8%.
Family Poverty Correlation Summary
| Measurement | Ethiopian | Shoshone |
| Minimum | 1.4% | 3.6% |
| Maximum | 24.9% | 37.5% |
| Range | 23.5% | 33.9% |
| Mean | 8.5% | 12.7% |
| Median | 8.2% | 9.4% |
| Interquartile 25% (IQ1) | 7.1% | 7.1% |
| Interquartile 75% (IQ3) | 9.4% | 16.2% |
| Interquartile Range (IQR) | 2.3% | 9.0% |
| Standard Deviation (Sample) | 3.8% | 7.8% |
| Standard Deviation (Population) | 3.8% | 7.7% |
Similar Demographics by Family Poverty
Demographics Similar to Ethiopians by Family Poverty
In terms of family poverty, the demographic groups most similar to Ethiopians are Pennsylvania German (8.8%, a difference of 0.050%), Immigrants from Northern Africa (8.8%, a difference of 0.090%), Hungarian (8.8%, a difference of 0.13%), Celtic (8.8%, a difference of 0.21%), and Guamanian/Chamorro (8.8%, a difference of 0.24%).
| Demographics | Rating | Rank | Family Poverty |
| Immigrants | Kuwait | 73.6 /100 | #155 | Good 8.7% |
| Immigrants | Oceania | 71.2 /100 | #156 | Good 8.7% |
| Tsimshian | 69.3 /100 | #157 | Good 8.8% |
| Whites/Caucasians | 69.1 /100 | #158 | Good 8.8% |
| Peruvians | 68.0 /100 | #159 | Good 8.8% |
| Hungarians | 67.2 /100 | #160 | Good 8.8% |
| Immigrants | Northern Africa | 66.9 /100 | #161 | Good 8.8% |
| Ethiopians | 66.3 /100 | #162 | Good 8.8% |
| Pennsylvania Germans | 66.0 /100 | #163 | Good 8.8% |
| Celtics | 64.9 /100 | #164 | Good 8.8% |
| Guamanians/Chamorros | 64.7 /100 | #165 | Good 8.8% |
| Afghans | 63.5 /100 | #166 | Good 8.8% |
| Immigrants | Ethiopia | 62.5 /100 | #167 | Good 8.9% |
| Israelis | 62.1 /100 | #168 | Good 8.9% |
| Immigrants | Chile | 59.6 /100 | #169 | Average 8.9% |
Demographics Similar to Shoshone by Family Poverty
In terms of family poverty, the demographic groups most similar to Shoshone are Bangladeshi (10.9%, a difference of 0.030%), Spanish American Indian (10.9%, a difference of 0.13%), Mexican American Indian (10.9%, a difference of 0.38%), Cape Verdean (10.9%, a difference of 0.39%), and Trinidadian and Tobagonian (10.9%, a difference of 0.41%).
| Demographics | Rating | Rank | Family Poverty |
| Ecuadorians | 0.2 /100 | #254 | Tragic 10.8% |
| Immigrants | Liberia | 0.2 /100 | #255 | Tragic 10.8% |
| Chickasaw | 0.2 /100 | #256 | Tragic 10.8% |
| Immigrants | Ghana | 0.2 /100 | #257 | Tragic 10.8% |
| Sub-Saharan Africans | 0.2 /100 | #258 | Tragic 10.9% |
| Mexican American Indians | 0.2 /100 | #259 | Tragic 10.9% |
| Bangladeshis | 0.2 /100 | #260 | Tragic 10.9% |
| Shoshone | 0.2 /100 | #261 | Tragic 10.9% |
| Spanish American Indians | 0.2 /100 | #262 | Tragic 10.9% |
| Cape Verdeans | 0.1 /100 | #263 | Tragic 10.9% |
| Trinidadians and Tobagonians | 0.1 /100 | #264 | Tragic 10.9% |
| Immigrants | Trinidad and Tobago | 0.1 /100 | #265 | Tragic 10.9% |
| Immigrants | El Salvador | 0.1 /100 | #266 | Tragic 11.0% |
| Comanche | 0.1 /100 | #267 | Tragic 11.0% |
| Jamaicans | 0.1 /100 | #268 | Tragic 11.1% |