Iranian vs Shoshone Family Poverty
COMPARE
Iranian
Shoshone
Family Poverty
Family Poverty Comparison
Iranians
Shoshone
7.1%
FAMILY POVERTY
99.8/ 100
METRIC RATING
14th/ 347
METRIC RANK
10.9%
FAMILY POVERTY
0.2/ 100
METRIC RATING
261st/ 347
METRIC RANK
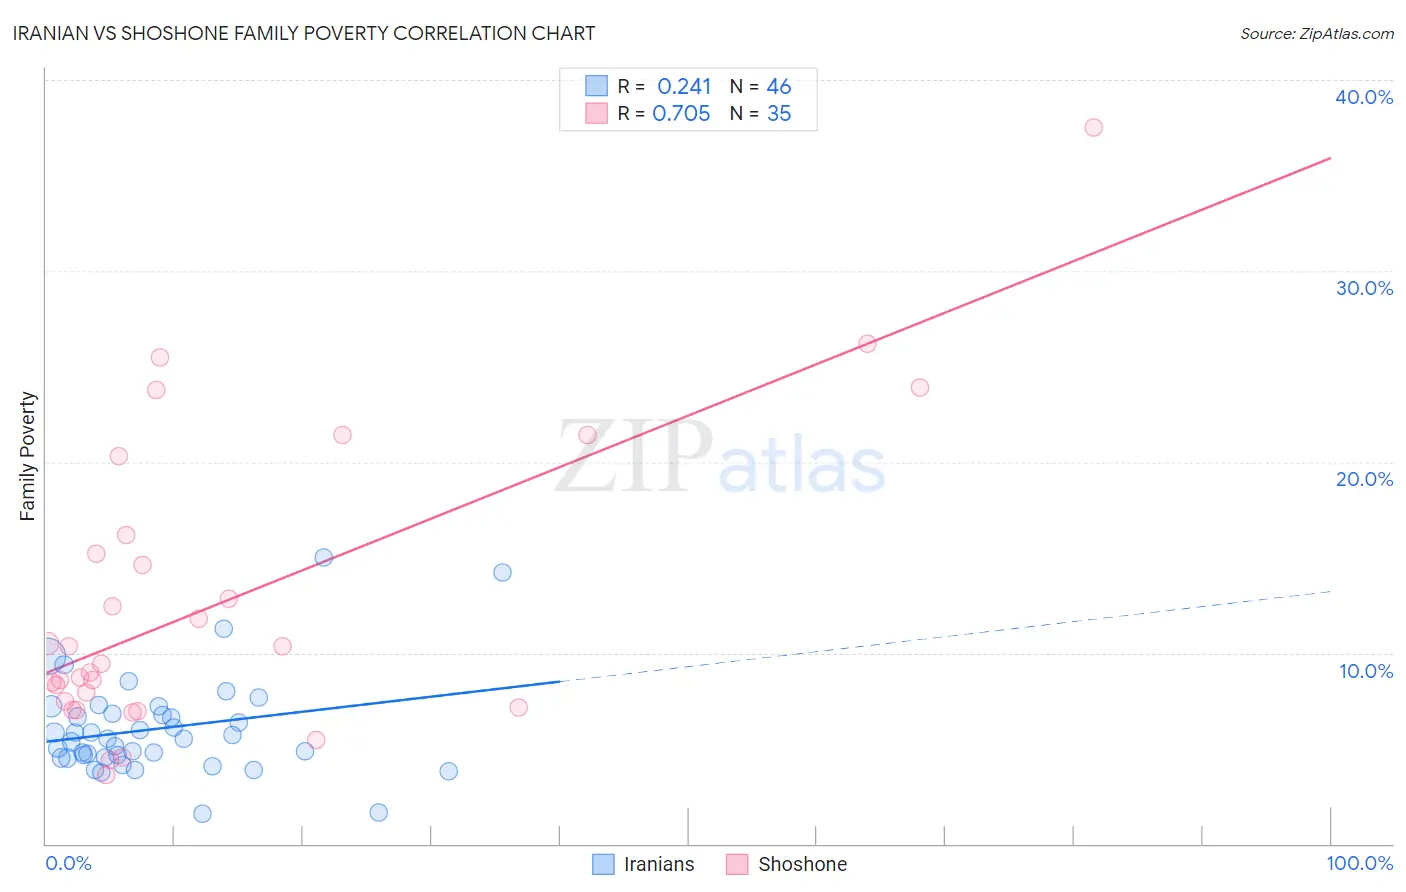
Iranian vs Shoshone Family Poverty Correlation Chart
The statistical analysis conducted on geographies consisting of 316,120,313 people shows a weak positive correlation between the proportion of Iranians and poverty level among families in the United States with a correlation coefficient (R) of 0.241 and weighted average of 7.1%. Similarly, the statistical analysis conducted on geographies consisting of 66,600,445 people shows a strong positive correlation between the proportion of Shoshone and poverty level among families in the United States with a correlation coefficient (R) of 0.705 and weighted average of 10.9%, a difference of 53.0%.
Family Poverty Correlation Summary
| Measurement | Iranian | Shoshone |
| Minimum | 1.6% | 3.6% |
| Maximum | 15.0% | 37.5% |
| Range | 13.4% | 33.9% |
| Mean | 6.0% | 12.7% |
| Median | 5.5% | 9.4% |
| Interquartile 25% (IQ1) | 4.5% | 7.1% |
| Interquartile 75% (IQ3) | 6.8% | 16.2% |
| Interquartile Range (IQR) | 2.3% | 9.0% |
| Standard Deviation (Sample) | 2.6% | 7.8% |
| Standard Deviation (Population) | 2.6% | 7.7% |
Similar Demographics by Family Poverty
Demographics Similar to Iranians by Family Poverty
In terms of family poverty, the demographic groups most similar to Iranians are Swedish (7.1%, a difference of 0.010%), Maltese (7.1%, a difference of 0.060%), Immigrants from Singapore (7.1%, a difference of 0.34%), Bulgarian (7.1%, a difference of 0.36%), and Latvian (7.1%, a difference of 0.61%).
| Demographics | Rating | Rank | Family Poverty |
| Immigrants | Ireland | 99.9 /100 | #7 | Exceptional 7.0% |
| Bhutanese | 99.9 /100 | #8 | Exceptional 7.0% |
| Latvians | 99.9 /100 | #9 | Exceptional 7.1% |
| Bulgarians | 99.8 /100 | #10 | Exceptional 7.1% |
| Immigrants | Singapore | 99.8 /100 | #11 | Exceptional 7.1% |
| Maltese | 99.8 /100 | #12 | Exceptional 7.1% |
| Swedes | 99.8 /100 | #13 | Exceptional 7.1% |
| Iranians | 99.8 /100 | #14 | Exceptional 7.1% |
| Lithuanians | 99.8 /100 | #15 | Exceptional 7.2% |
| Immigrants | South Central Asia | 99.8 /100 | #16 | Exceptional 7.2% |
| Luxembourgers | 99.8 /100 | #17 | Exceptional 7.2% |
| Immigrants | Lithuania | 99.8 /100 | #18 | Exceptional 7.2% |
| Eastern Europeans | 99.7 /100 | #19 | Exceptional 7.2% |
| Immigrants | Hong Kong | 99.7 /100 | #20 | Exceptional 7.3% |
| Immigrants | Iran | 99.7 /100 | #21 | Exceptional 7.3% |
Demographics Similar to Shoshone by Family Poverty
In terms of family poverty, the demographic groups most similar to Shoshone are Bangladeshi (10.9%, a difference of 0.030%), Spanish American Indian (10.9%, a difference of 0.13%), Mexican American Indian (10.9%, a difference of 0.38%), Cape Verdean (10.9%, a difference of 0.39%), and Trinidadian and Tobagonian (10.9%, a difference of 0.41%).
| Demographics | Rating | Rank | Family Poverty |
| Ecuadorians | 0.2 /100 | #254 | Tragic 10.8% |
| Immigrants | Liberia | 0.2 /100 | #255 | Tragic 10.8% |
| Chickasaw | 0.2 /100 | #256 | Tragic 10.8% |
| Immigrants | Ghana | 0.2 /100 | #257 | Tragic 10.8% |
| Sub-Saharan Africans | 0.2 /100 | #258 | Tragic 10.9% |
| Mexican American Indians | 0.2 /100 | #259 | Tragic 10.9% |
| Bangladeshis | 0.2 /100 | #260 | Tragic 10.9% |
| Shoshone | 0.2 /100 | #261 | Tragic 10.9% |
| Spanish American Indians | 0.2 /100 | #262 | Tragic 10.9% |
| Cape Verdeans | 0.1 /100 | #263 | Tragic 10.9% |
| Trinidadians and Tobagonians | 0.1 /100 | #264 | Tragic 10.9% |
| Immigrants | Trinidad and Tobago | 0.1 /100 | #265 | Tragic 10.9% |
| Immigrants | El Salvador | 0.1 /100 | #266 | Tragic 11.0% |
| Comanche | 0.1 /100 | #267 | Tragic 11.0% |
| Jamaicans | 0.1 /100 | #268 | Tragic 11.1% |