Ethiopian vs French Canadian Family Poverty
COMPARE
Ethiopian
French Canadian
Family Poverty
Family Poverty Comparison
Ethiopians
French Canadians
8.8%
FAMILY POVERTY
66.3/ 100
METRIC RATING
162nd/ 347
METRIC RANK
8.1%
FAMILY POVERTY
95.0/ 100
METRIC RATING
107th/ 347
METRIC RANK
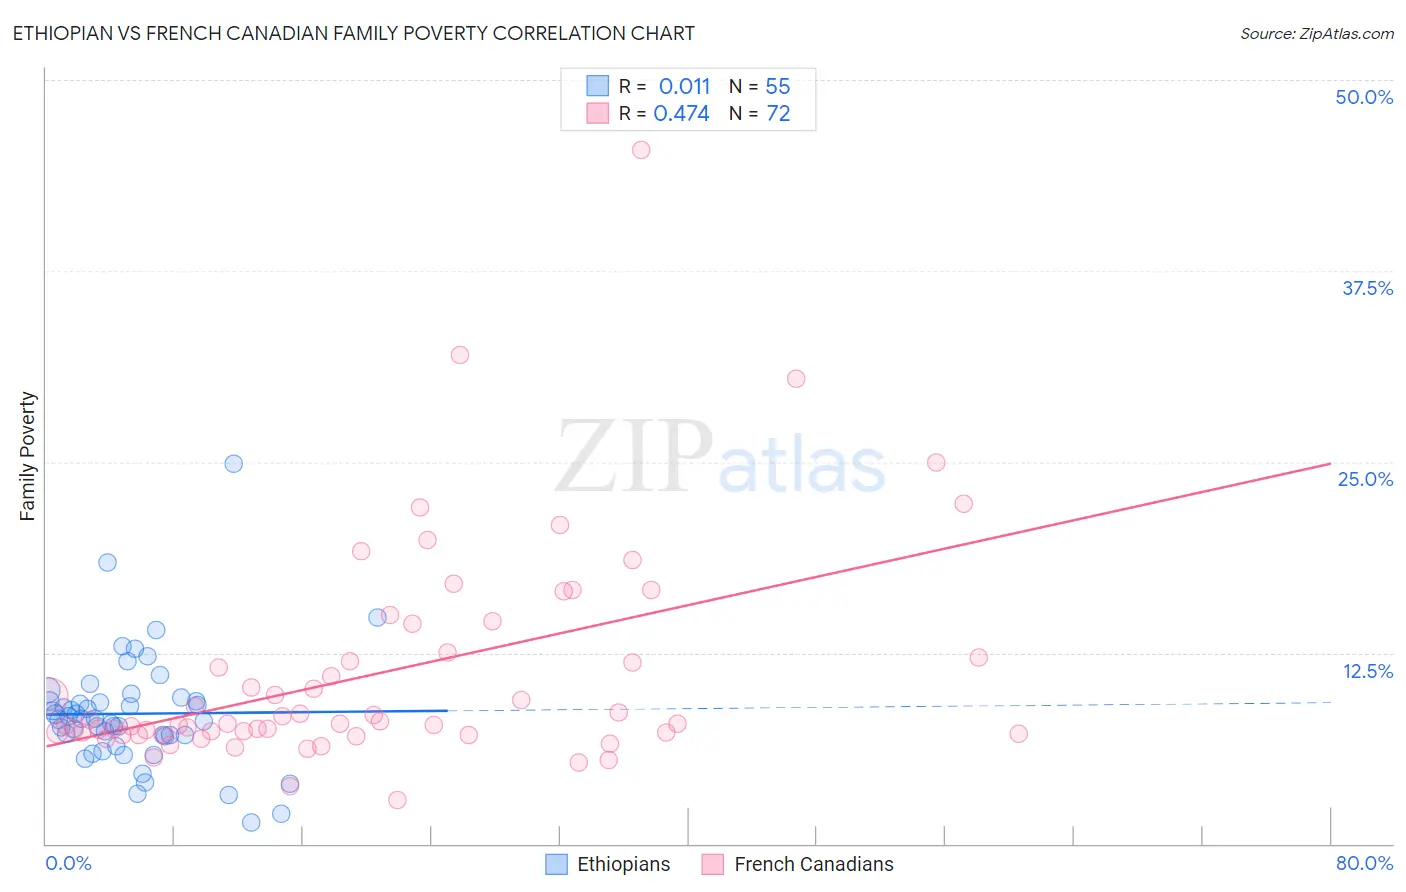
Ethiopian vs French Canadian Family Poverty Correlation Chart
The statistical analysis conducted on geographies consisting of 222,923,037 people shows no correlation between the proportion of Ethiopians and poverty level among families in the United States with a correlation coefficient (R) of 0.011 and weighted average of 8.8%. Similarly, the statistical analysis conducted on geographies consisting of 499,881,871 people shows a moderate positive correlation between the proportion of French Canadians and poverty level among families in the United States with a correlation coefficient (R) of 0.474 and weighted average of 8.1%, a difference of 8.2%.
Family Poverty Correlation Summary
| Measurement | Ethiopian | French Canadian |
| Minimum | 1.4% | 2.9% |
| Maximum | 24.9% | 45.5% |
| Range | 23.5% | 42.6% |
| Mean | 8.5% | 11.1% |
| Median | 8.2% | 7.9% |
| Interquartile 25% (IQ1) | 7.1% | 7.2% |
| Interquartile 75% (IQ3) | 9.4% | 12.3% |
| Interquartile Range (IQR) | 2.3% | 5.1% |
| Standard Deviation (Sample) | 3.8% | 7.2% |
| Standard Deviation (Population) | 3.8% | 7.1% |
Similar Demographics by Family Poverty
Demographics Similar to Ethiopians by Family Poverty
In terms of family poverty, the demographic groups most similar to Ethiopians are Pennsylvania German (8.8%, a difference of 0.050%), Immigrants from Northern Africa (8.8%, a difference of 0.090%), Hungarian (8.8%, a difference of 0.13%), Celtic (8.8%, a difference of 0.21%), and Guamanian/Chamorro (8.8%, a difference of 0.24%).
| Demographics | Rating | Rank | Family Poverty |
| Immigrants | Kuwait | 73.6 /100 | #155 | Good 8.7% |
| Immigrants | Oceania | 71.2 /100 | #156 | Good 8.7% |
| Tsimshian | 69.3 /100 | #157 | Good 8.8% |
| Whites/Caucasians | 69.1 /100 | #158 | Good 8.8% |
| Peruvians | 68.0 /100 | #159 | Good 8.8% |
| Hungarians | 67.2 /100 | #160 | Good 8.8% |
| Immigrants | Northern Africa | 66.9 /100 | #161 | Good 8.8% |
| Ethiopians | 66.3 /100 | #162 | Good 8.8% |
| Pennsylvania Germans | 66.0 /100 | #163 | Good 8.8% |
| Celtics | 64.9 /100 | #164 | Good 8.8% |
| Guamanians/Chamorros | 64.7 /100 | #165 | Good 8.8% |
| Afghans | 63.5 /100 | #166 | Good 8.8% |
| Immigrants | Ethiopia | 62.5 /100 | #167 | Good 8.9% |
| Israelis | 62.1 /100 | #168 | Good 8.9% |
| Immigrants | Chile | 59.6 /100 | #169 | Average 8.9% |
Demographics Similar to French Canadians by Family Poverty
In terms of family poverty, the demographic groups most similar to French Canadians are Egyptian (8.1%, a difference of 0.040%), Basque (8.1%, a difference of 0.090%), Jordanian (8.2%, a difference of 0.18%), Romanian (8.2%, a difference of 0.27%), and Taiwanese (8.2%, a difference of 0.32%).
| Demographics | Rating | Rank | Family Poverty |
| New Zealanders | 95.8 /100 | #100 | Exceptional 8.1% |
| Immigrants | Norway | 95.7 /100 | #101 | Exceptional 8.1% |
| Immigrants | Indonesia | 95.7 /100 | #102 | Exceptional 8.1% |
| Immigrants | Eastern Europe | 95.6 /100 | #103 | Exceptional 8.1% |
| Slavs | 95.6 /100 | #104 | Exceptional 8.1% |
| Laotians | 95.6 /100 | #105 | Exceptional 8.1% |
| Egyptians | 95.1 /100 | #106 | Exceptional 8.1% |
| French Canadians | 95.0 /100 | #107 | Exceptional 8.1% |
| Basques | 94.9 /100 | #108 | Exceptional 8.1% |
| Jordanians | 94.8 /100 | #109 | Exceptional 8.2% |
| Romanians | 94.7 /100 | #110 | Exceptional 8.2% |
| Taiwanese | 94.6 /100 | #111 | Exceptional 8.2% |
| Immigrants | France | 94.4 /100 | #112 | Exceptional 8.2% |
| Canadians | 94.2 /100 | #113 | Exceptional 8.2% |
| Immigrants | Zimbabwe | 94.0 /100 | #114 | Exceptional 8.2% |