Ethiopian vs Spanish American Family Poverty
COMPARE
Ethiopian
Spanish American
Family Poverty
Family Poverty Comparison
Ethiopians
Spanish Americans
8.8%
FAMILY POVERTY
66.3/ 100
METRIC RATING
162nd/ 347
METRIC RANK
11.2%
FAMILY POVERTY
0.1/ 100
METRIC RATING
274th/ 347
METRIC RANK
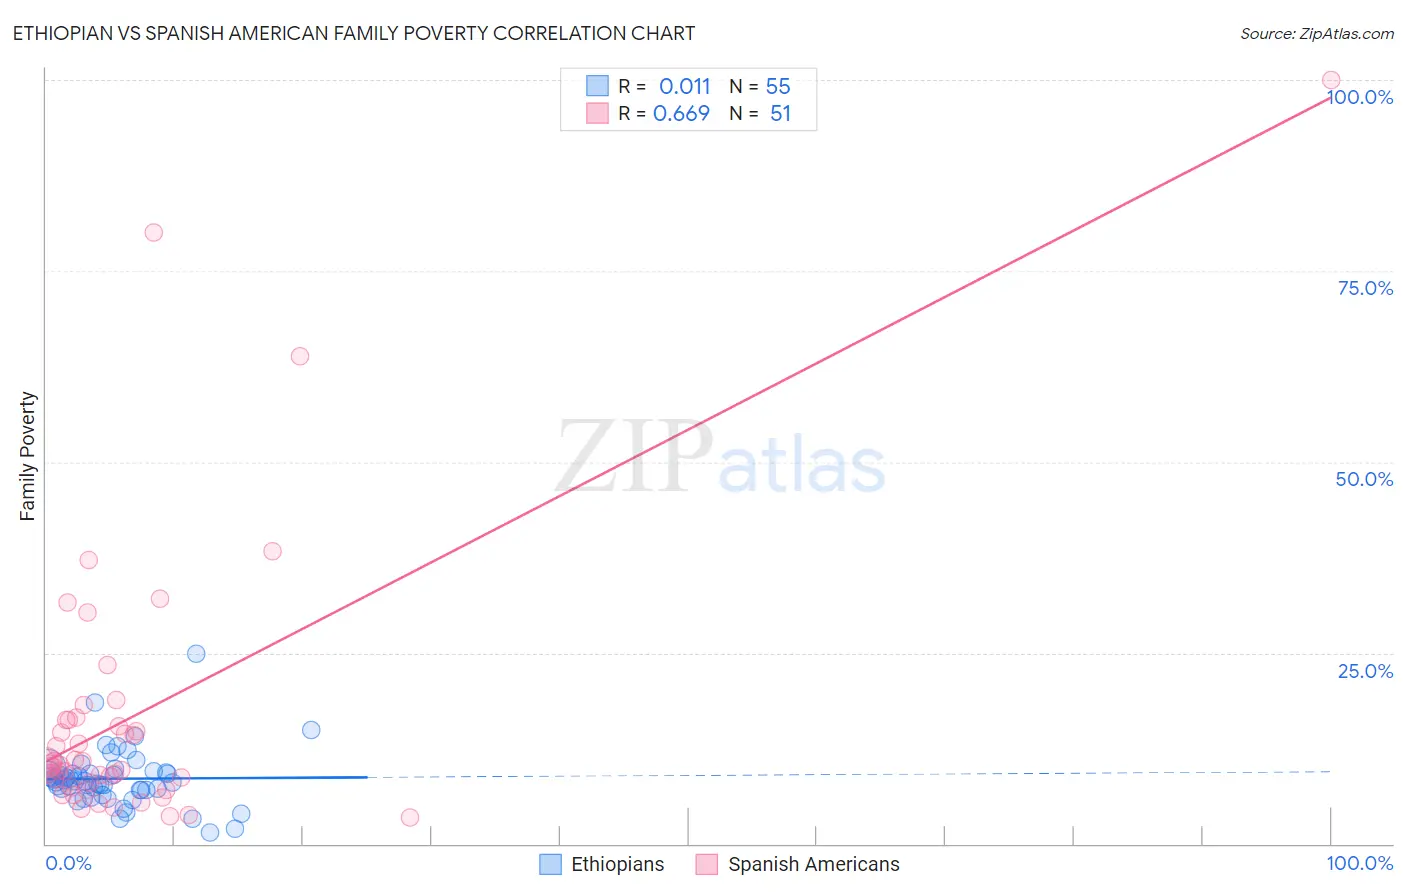
Ethiopian vs Spanish American Family Poverty Correlation Chart
The statistical analysis conducted on geographies consisting of 222,923,037 people shows no correlation between the proportion of Ethiopians and poverty level among families in the United States with a correlation coefficient (R) of 0.011 and weighted average of 8.8%. Similarly, the statistical analysis conducted on geographies consisting of 103,138,189 people shows a significant positive correlation between the proportion of Spanish Americans and poverty level among families in the United States with a correlation coefficient (R) of 0.669 and weighted average of 11.2%, a difference of 27.4%.
Family Poverty Correlation Summary
| Measurement | Ethiopian | Spanish American |
| Minimum | 1.4% | 3.4% |
| Maximum | 24.9% | 100.0% |
| Range | 23.5% | 96.6% |
| Mean | 8.5% | 16.8% |
| Median | 8.2% | 10.5% |
| Interquartile 25% (IQ1) | 7.1% | 7.4% |
| Interquartile 75% (IQ3) | 9.4% | 16.2% |
| Interquartile Range (IQR) | 2.3% | 8.8% |
| Standard Deviation (Sample) | 3.8% | 18.6% |
| Standard Deviation (Population) | 3.8% | 18.4% |
Similar Demographics by Family Poverty
Demographics Similar to Ethiopians by Family Poverty
In terms of family poverty, the demographic groups most similar to Ethiopians are Pennsylvania German (8.8%, a difference of 0.050%), Immigrants from Northern Africa (8.8%, a difference of 0.090%), Hungarian (8.8%, a difference of 0.13%), Celtic (8.8%, a difference of 0.21%), and Guamanian/Chamorro (8.8%, a difference of 0.24%).
| Demographics | Rating | Rank | Family Poverty |
| Immigrants | Kuwait | 73.6 /100 | #155 | Good 8.7% |
| Immigrants | Oceania | 71.2 /100 | #156 | Good 8.7% |
| Tsimshian | 69.3 /100 | #157 | Good 8.8% |
| Whites/Caucasians | 69.1 /100 | #158 | Good 8.8% |
| Peruvians | 68.0 /100 | #159 | Good 8.8% |
| Hungarians | 67.2 /100 | #160 | Good 8.8% |
| Immigrants | Northern Africa | 66.9 /100 | #161 | Good 8.8% |
| Ethiopians | 66.3 /100 | #162 | Good 8.8% |
| Pennsylvania Germans | 66.0 /100 | #163 | Good 8.8% |
| Celtics | 64.9 /100 | #164 | Good 8.8% |
| Guamanians/Chamorros | 64.7 /100 | #165 | Good 8.8% |
| Afghans | 63.5 /100 | #166 | Good 8.8% |
| Immigrants | Ethiopia | 62.5 /100 | #167 | Good 8.9% |
| Israelis | 62.1 /100 | #168 | Good 8.9% |
| Immigrants | Chile | 59.6 /100 | #169 | Average 8.9% |
Demographics Similar to Spanish Americans by Family Poverty
In terms of family poverty, the demographic groups most similar to Spanish Americans are Central American (11.2%, a difference of 0.050%), Immigrants from Guyana (11.2%, a difference of 0.070%), Somali (11.2%, a difference of 0.090%), Chippewa (11.2%, a difference of 0.16%), and Guyanese (11.2%, a difference of 0.19%).
| Demographics | Rating | Rank | Family Poverty |
| Comanche | 0.1 /100 | #267 | Tragic 11.0% |
| Jamaicans | 0.1 /100 | #268 | Tragic 11.1% |
| Immigrants | Ecuador | 0.1 /100 | #269 | Tragic 11.1% |
| Immigrants | Nicaragua | 0.1 /100 | #270 | Tragic 11.1% |
| Immigrants | Bahamas | 0.1 /100 | #271 | Tragic 11.1% |
| Immigrants | Jamaica | 0.1 /100 | #272 | Tragic 11.2% |
| Somalis | 0.1 /100 | #273 | Tragic 11.2% |
| Spanish Americans | 0.1 /100 | #274 | Tragic 11.2% |
| Central Americans | 0.1 /100 | #275 | Tragic 11.2% |
| Immigrants | Guyana | 0.1 /100 | #276 | Tragic 11.2% |
| Chippewa | 0.1 /100 | #277 | Tragic 11.2% |
| Guyanese | 0.1 /100 | #278 | Tragic 11.2% |
| Blackfeet | 0.0 /100 | #279 | Tragic 11.3% |
| Belizeans | 0.0 /100 | #280 | Tragic 11.3% |
| Immigrants | West Indies | 0.0 /100 | #281 | Tragic 11.3% |