Ethiopian vs Shoshone Unemployment Among Ages 20 to 24 years
COMPARE
Ethiopian
Shoshone
Unemployment Among Ages 20 to 24 years
Unemployment Among Ages 20 to 24 years Comparison
Ethiopians
Shoshone
9.8%
UNEMPLOYMENT AMONG AGES 20 TO 24 YEARS
99.7/ 100
METRIC RATING
51st/ 347
METRIC RANK
12.7%
UNEMPLOYMENT AMONG AGES 20 TO 24 YEARS
0.0/ 100
METRIC RATING
313th/ 347
METRIC RANK
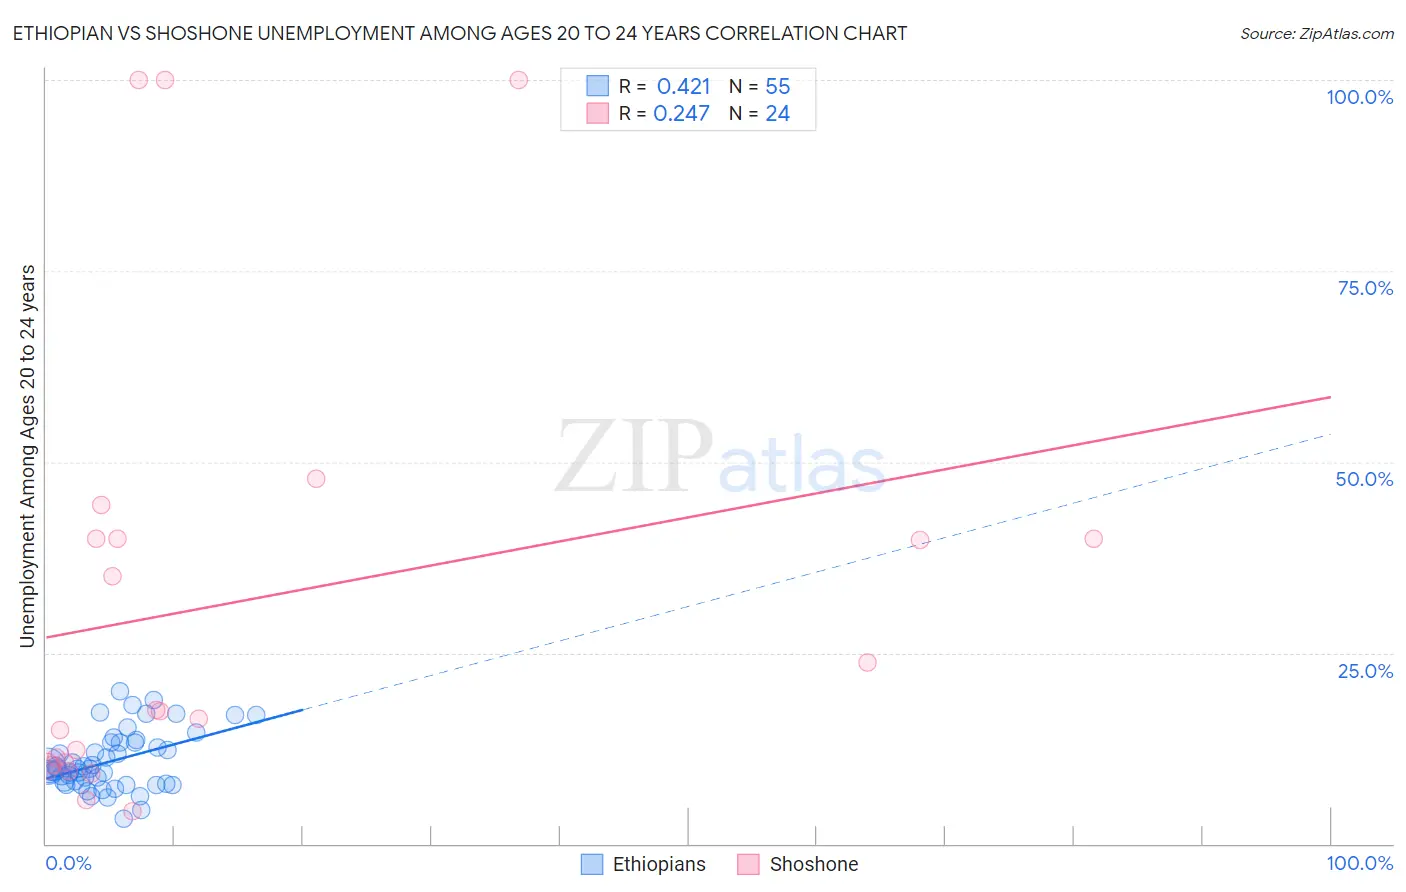
Ethiopian vs Shoshone Unemployment Among Ages 20 to 24 years Correlation Chart
The statistical analysis conducted on geographies consisting of 220,623,772 people shows a moderate positive correlation between the proportion of Ethiopians and unemployment rate among population between the ages 20 and 24 in the United States with a correlation coefficient (R) of 0.421 and weighted average of 9.8%. Similarly, the statistical analysis conducted on geographies consisting of 65,930,341 people shows a weak positive correlation between the proportion of Shoshone and unemployment rate among population between the ages 20 and 24 in the United States with a correlation coefficient (R) of 0.247 and weighted average of 12.7%, a difference of 30.3%.
Unemployment Among Ages 20 to 24 years Correlation Summary
| Measurement | Ethiopian | Shoshone |
| Minimum | 3.2% | 4.3% |
| Maximum | 20.0% | 100.0% |
| Range | 16.8% | 95.7% |
| Mean | 10.8% | 31.7% |
| Median | 9.8% | 17.4% |
| Interquartile 25% (IQ1) | 7.8% | 10.5% |
| Interquartile 75% (IQ3) | 13.3% | 40.0% |
| Interquartile Range (IQR) | 5.5% | 29.5% |
| Standard Deviation (Sample) | 3.8% | 29.7% |
| Standard Deviation (Population) | 3.8% | 29.1% |
Similar Demographics by Unemployment Among Ages 20 to 24 years
Demographics Similar to Ethiopians by Unemployment Among Ages 20 to 24 years
In terms of unemployment among ages 20 to 24 years, the demographic groups most similar to Ethiopians are Immigrants from Kenya (9.7%, a difference of 0.070%), Immigrants from Thailand (9.8%, a difference of 0.11%), Creek (9.7%, a difference of 0.21%), Immigrants from Serbia (9.8%, a difference of 0.22%), and Immigrants from Cambodia (9.8%, a difference of 0.26%).
| Demographics | Rating | Rank | Unemployment Among Ages 20 to 24 years |
| Europeans | 99.8 /100 | #44 | Exceptional 9.7% |
| Croatians | 99.8 /100 | #45 | Exceptional 9.7% |
| Immigrants | Nicaragua | 99.8 /100 | #46 | Exceptional 9.7% |
| Immigrants | India | 99.8 /100 | #47 | Exceptional 9.7% |
| Finns | 99.8 /100 | #48 | Exceptional 9.7% |
| Creek | 99.8 /100 | #49 | Exceptional 9.7% |
| Immigrants | Kenya | 99.7 /100 | #50 | Exceptional 9.7% |
| Ethiopians | 99.7 /100 | #51 | Exceptional 9.8% |
| Immigrants | Thailand | 99.7 /100 | #52 | Exceptional 9.8% |
| Immigrants | Serbia | 99.6 /100 | #53 | Exceptional 9.8% |
| Immigrants | Cambodia | 99.6 /100 | #54 | Exceptional 9.8% |
| Carpatho Rusyns | 99.6 /100 | #55 | Exceptional 9.8% |
| Nicaraguans | 99.6 /100 | #56 | Exceptional 9.8% |
| Immigrants | Moldova | 99.5 /100 | #57 | Exceptional 9.8% |
| Pakistanis | 99.5 /100 | #58 | Exceptional 9.8% |
Demographics Similar to Shoshone by Unemployment Among Ages 20 to 24 years
In terms of unemployment among ages 20 to 24 years, the demographic groups most similar to Shoshone are Black/African American (12.7%, a difference of 0.19%), West Indian (12.8%, a difference of 0.40%), Houma (12.6%, a difference of 0.53%), Vietnamese (12.6%, a difference of 0.69%), and Immigrants from Dominica (12.8%, a difference of 0.88%).
| Demographics | Rating | Rank | Unemployment Among Ages 20 to 24 years |
| Immigrants | Haiti | 0.0 /100 | #306 | Tragic 12.4% |
| Bermudans | 0.0 /100 | #307 | Tragic 12.5% |
| Tohono O'odham | 0.0 /100 | #308 | Tragic 12.5% |
| Immigrants | Bangladesh | 0.0 /100 | #309 | Tragic 12.6% |
| Jamaicans | 0.0 /100 | #310 | Tragic 12.6% |
| Vietnamese | 0.0 /100 | #311 | Tragic 12.6% |
| Houma | 0.0 /100 | #312 | Tragic 12.6% |
| Shoshone | 0.0 /100 | #313 | Tragic 12.7% |
| Blacks/African Americans | 0.0 /100 | #314 | Tragic 12.7% |
| West Indians | 0.0 /100 | #315 | Tragic 12.8% |
| Immigrants | Dominica | 0.0 /100 | #316 | Tragic 12.8% |
| Immigrants | Trinidad and Tobago | 0.0 /100 | #317 | Tragic 12.8% |
| Barbadians | 0.0 /100 | #318 | Tragic 12.9% |
| Trinidadians and Tobagonians | 0.0 /100 | #319 | Tragic 12.9% |
| Cheyenne | 0.0 /100 | #320 | Tragic 13.0% |