Immigrants from Guatemala vs Immigrants from Uganda Poverty
COMPARE
Immigrants from Guatemala
Immigrants from Uganda
Poverty
Poverty Comparison
Immigrants from Guatemala
Immigrants from Uganda
15.5%
POVERTY
0.0/ 100
METRIC RATING
305th/ 347
METRIC RANK
12.8%
POVERTY
16.5/ 100
METRIC RATING
201st/ 347
METRIC RANK
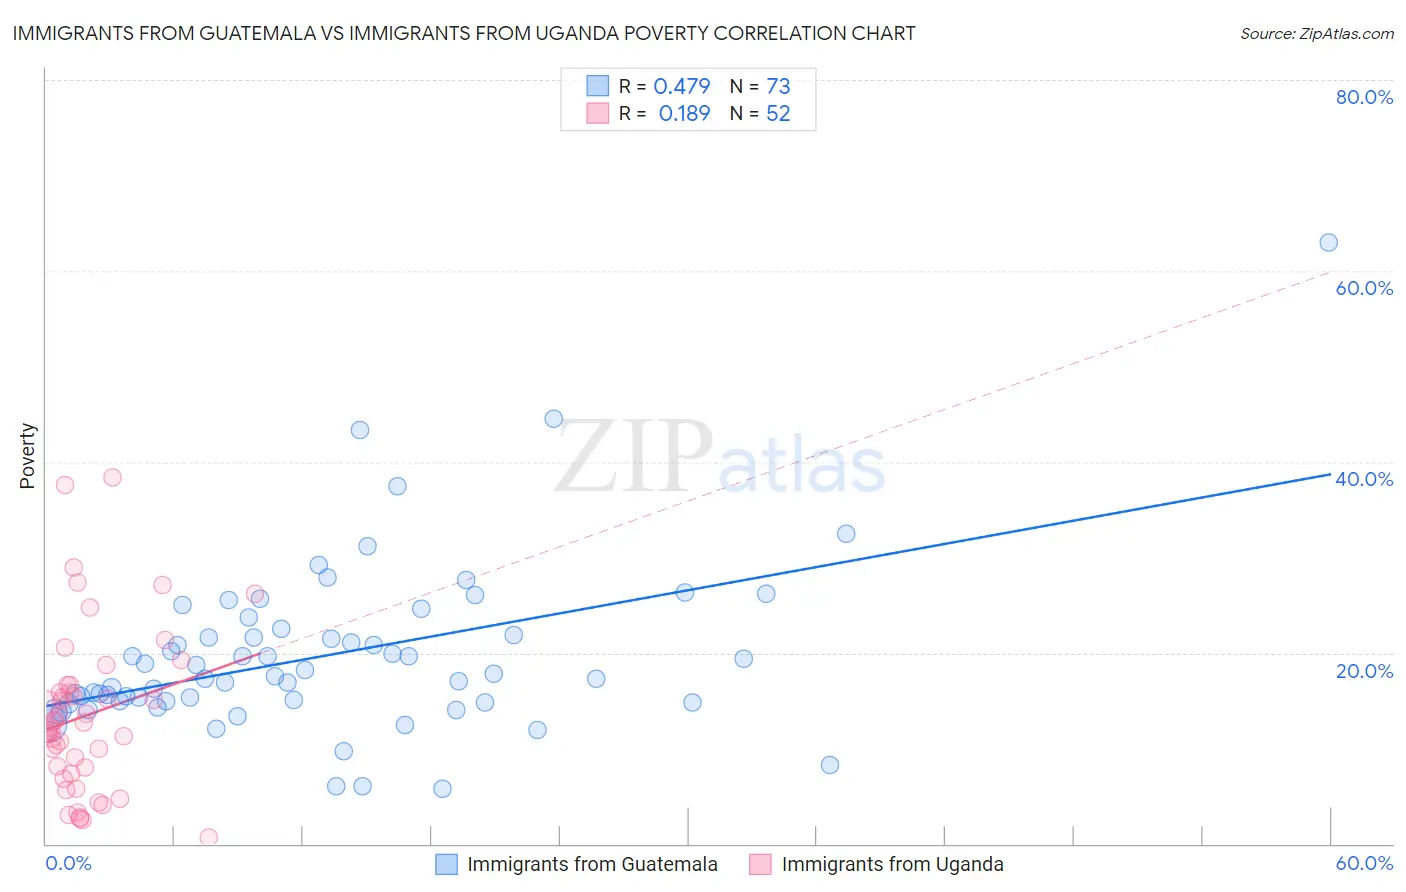
Immigrants from Guatemala vs Immigrants from Uganda Poverty Correlation Chart
The statistical analysis conducted on geographies consisting of 377,145,894 people shows a moderate positive correlation between the proportion of Immigrants from Guatemala and poverty level in the United States with a correlation coefficient (R) of 0.479 and weighted average of 15.5%. Similarly, the statistical analysis conducted on geographies consisting of 125,970,249 people shows a poor positive correlation between the proportion of Immigrants from Uganda and poverty level in the United States with a correlation coefficient (R) of 0.189 and weighted average of 12.8%, a difference of 21.1%.
Poverty Correlation Summary
| Measurement | Immigrants from Guatemala | Immigrants from Uganda |
| Minimum | 5.8% | 0.63% |
| Maximum | 62.9% | 38.4% |
| Range | 57.2% | 37.8% |
| Mean | 19.7% | 13.5% |
| Median | 17.5% | 12.4% |
| Interquartile 25% (IQ1) | 14.8% | 7.7% |
| Interquartile 75% (IQ3) | 22.2% | 16.2% |
| Interquartile Range (IQR) | 7.3% | 8.6% |
| Standard Deviation (Sample) | 8.9% | 8.5% |
| Standard Deviation (Population) | 8.9% | 8.4% |
Similar Demographics by Poverty
Demographics Similar to Immigrants from Guatemala by Poverty
In terms of poverty, the demographic groups most similar to Immigrants from Guatemala are Immigrants from Mexico (15.5%, a difference of 0.030%), Immigrants from Caribbean (15.5%, a difference of 0.12%), Creek (15.6%, a difference of 0.44%), African (15.6%, a difference of 0.51%), and Somali (15.4%, a difference of 0.61%).
| Demographics | Rating | Rank | Poverty |
| Immigrants | Senegal | 0.0 /100 | #298 | Tragic 15.3% |
| Senegalese | 0.0 /100 | #299 | Tragic 15.3% |
| Immigrants | Central America | 0.0 /100 | #300 | Tragic 15.4% |
| Bahamians | 0.0 /100 | #301 | Tragic 15.4% |
| Somalis | 0.0 /100 | #302 | Tragic 15.4% |
| Immigrants | Caribbean | 0.0 /100 | #303 | Tragic 15.5% |
| Immigrants | Mexico | 0.0 /100 | #304 | Tragic 15.5% |
| Immigrants | Guatemala | 0.0 /100 | #305 | Tragic 15.5% |
| Creek | 0.0 /100 | #306 | Tragic 15.6% |
| Africans | 0.0 /100 | #307 | Tragic 15.6% |
| Choctaw | 0.0 /100 | #308 | Tragic 15.6% |
| Seminole | 0.0 /100 | #309 | Tragic 15.6% |
| Dutch West Indians | 0.0 /100 | #310 | Tragic 15.6% |
| Chippewa | 0.0 /100 | #311 | Tragic 15.7% |
| Cajuns | 0.0 /100 | #312 | Tragic 15.7% |
Demographics Similar to Immigrants from Uganda by Poverty
In terms of poverty, the demographic groups most similar to Immigrants from Uganda are Spaniard (12.8%, a difference of 0.0%), Immigrants from Kenya (12.8%, a difference of 0.16%), Immigrants from Uruguay (12.8%, a difference of 0.16%), Hmong (12.8%, a difference of 0.26%), and Immigrants from Lebanon (12.8%, a difference of 0.35%).
| Demographics | Rating | Rank | Poverty |
| Arabs | 21.1 /100 | #194 | Fair 12.7% |
| Immigrants | Kuwait | 20.9 /100 | #195 | Fair 12.7% |
| Iraqis | 20.8 /100 | #196 | Fair 12.7% |
| Immigrants | Lebanon | 18.7 /100 | #197 | Poor 12.8% |
| Spanish | 18.7 /100 | #198 | Poor 12.8% |
| Immigrants | Kenya | 17.5 /100 | #199 | Poor 12.8% |
| Spaniards | 16.5 /100 | #200 | Poor 12.8% |
| Immigrants | Uganda | 16.5 /100 | #201 | Poor 12.8% |
| Immigrants | Uruguay | 15.6 /100 | #202 | Poor 12.8% |
| Hmong | 15.0 /100 | #203 | Poor 12.8% |
| Immigrants | Western Asia | 14.1 /100 | #204 | Poor 12.9% |
| Tsimshian | 9.2 /100 | #205 | Tragic 13.0% |
| Immigrants | Eastern Africa | 7.0 /100 | #206 | Tragic 13.1% |
| Panamanians | 6.6 /100 | #207 | Tragic 13.1% |
| Ugandans | 6.2 /100 | #208 | Tragic 13.1% |