Pima vs Immigrants from Uganda Poverty
COMPARE
Pima
Immigrants from Uganda
Poverty
Poverty Comparison
Pima
Immigrants from Uganda
21.9%
POVERTY
0.0/ 100
METRIC RATING
343rd/ 347
METRIC RANK
12.8%
POVERTY
16.5/ 100
METRIC RATING
201st/ 347
METRIC RANK
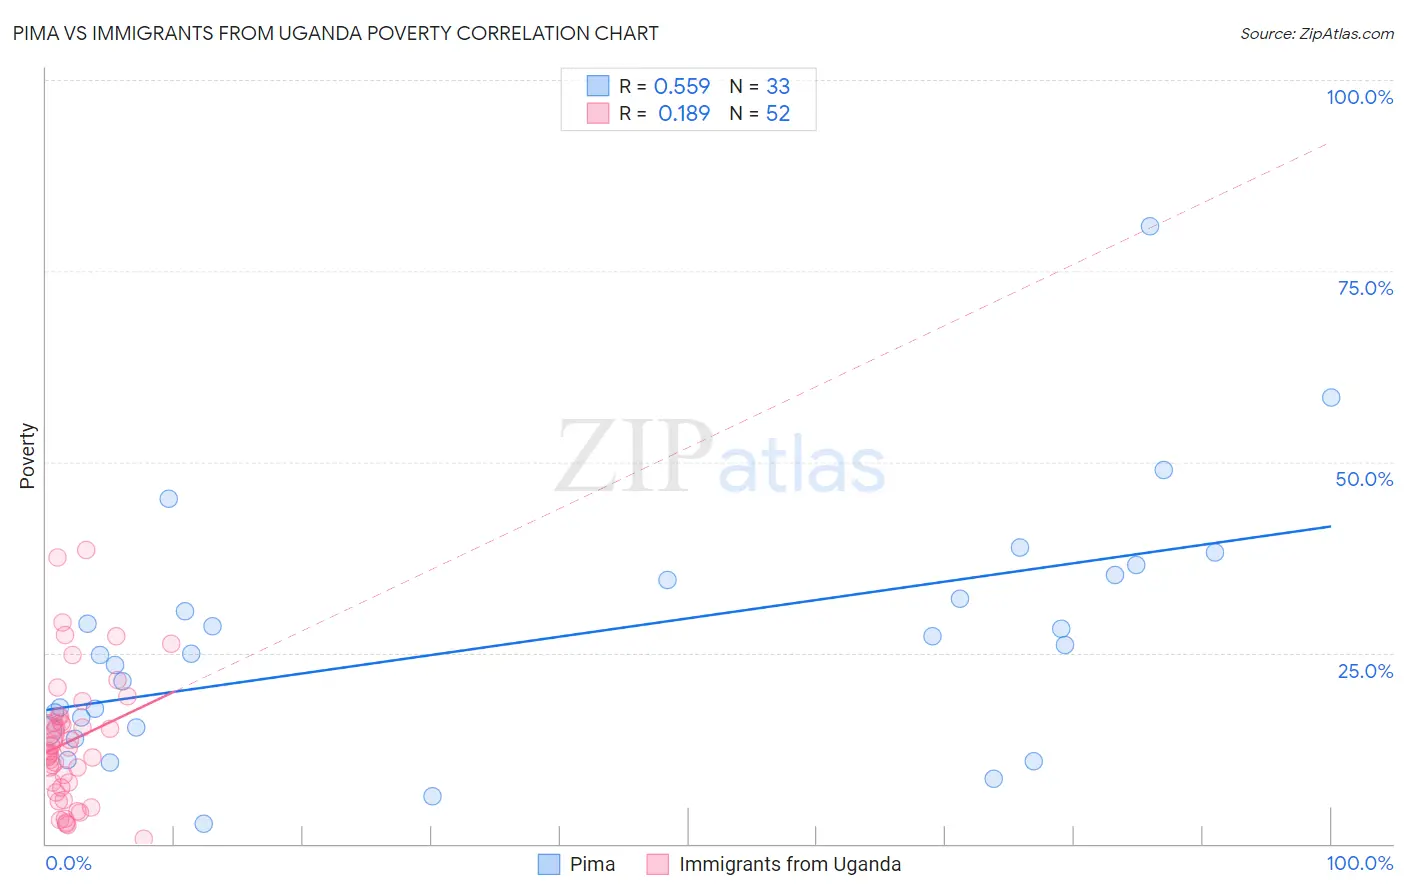
Pima vs Immigrants from Uganda Poverty Correlation Chart
The statistical analysis conducted on geographies consisting of 61,541,821 people shows a substantial positive correlation between the proportion of Pima and poverty level in the United States with a correlation coefficient (R) of 0.559 and weighted average of 21.9%. Similarly, the statistical analysis conducted on geographies consisting of 125,970,249 people shows a poor positive correlation between the proportion of Immigrants from Uganda and poverty level in the United States with a correlation coefficient (R) of 0.189 and weighted average of 12.8%, a difference of 70.7%.
Poverty Correlation Summary
| Measurement | Pima | Immigrants from Uganda |
| Minimum | 2.5% | 0.63% |
| Maximum | 80.8% | 38.4% |
| Range | 78.3% | 37.8% |
| Mean | 26.5% | 13.5% |
| Median | 24.9% | 12.4% |
| Interquartile 25% (IQ1) | 15.0% | 7.7% |
| Interquartile 75% (IQ3) | 34.9% | 16.2% |
| Interquartile Range (IQR) | 19.8% | 8.6% |
| Standard Deviation (Sample) | 16.1% | 8.5% |
| Standard Deviation (Population) | 15.8% | 8.4% |
Similar Demographics by Poverty
Demographics Similar to Pima by Poverty
In terms of poverty, the demographic groups most similar to Pima are Lumbee (21.9%, a difference of 0.26%), Immigrants from Yemen (21.5%, a difference of 1.6%), Hopi (20.8%, a difference of 4.8%), Yup'ik (20.8%, a difference of 5.0%), and Navajo (23.1%, a difference of 5.6%).
| Demographics | Rating | Rank | Poverty |
| Houma | 0.0 /100 | #333 | Tragic 18.4% |
| Apache | 0.0 /100 | #334 | Tragic 18.4% |
| Cheyenne | 0.0 /100 | #335 | Tragic 18.9% |
| Pueblo | 0.0 /100 | #336 | Tragic 19.4% |
| Sioux | 0.0 /100 | #337 | Tragic 19.8% |
| Yuman | 0.0 /100 | #338 | Tragic 20.2% |
| Crow | 0.0 /100 | #339 | Tragic 20.7% |
| Yup'ik | 0.0 /100 | #340 | Tragic 20.8% |
| Hopi | 0.0 /100 | #341 | Tragic 20.8% |
| Immigrants | Yemen | 0.0 /100 | #342 | Tragic 21.5% |
| Pima | 0.0 /100 | #343 | Tragic 21.9% |
| Lumbee | 0.0 /100 | #344 | Tragic 21.9% |
| Navajo | 0.0 /100 | #345 | Tragic 23.1% |
| Puerto Ricans | 0.0 /100 | #346 | Tragic 23.7% |
| Tohono O'odham | 0.0 /100 | #347 | Tragic 24.4% |
Demographics Similar to Immigrants from Uganda by Poverty
In terms of poverty, the demographic groups most similar to Immigrants from Uganda are Spaniard (12.8%, a difference of 0.0%), Immigrants from Kenya (12.8%, a difference of 0.16%), Immigrants from Uruguay (12.8%, a difference of 0.16%), Hmong (12.8%, a difference of 0.26%), and Immigrants from Lebanon (12.8%, a difference of 0.35%).
| Demographics | Rating | Rank | Poverty |
| Arabs | 21.1 /100 | #194 | Fair 12.7% |
| Immigrants | Kuwait | 20.9 /100 | #195 | Fair 12.7% |
| Iraqis | 20.8 /100 | #196 | Fair 12.7% |
| Immigrants | Lebanon | 18.7 /100 | #197 | Poor 12.8% |
| Spanish | 18.7 /100 | #198 | Poor 12.8% |
| Immigrants | Kenya | 17.5 /100 | #199 | Poor 12.8% |
| Spaniards | 16.5 /100 | #200 | Poor 12.8% |
| Immigrants | Uganda | 16.5 /100 | #201 | Poor 12.8% |
| Immigrants | Uruguay | 15.6 /100 | #202 | Poor 12.8% |
| Hmong | 15.0 /100 | #203 | Poor 12.8% |
| Immigrants | Western Asia | 14.1 /100 | #204 | Poor 12.9% |
| Tsimshian | 9.2 /100 | #205 | Tragic 13.0% |
| Immigrants | Eastern Africa | 7.0 /100 | #206 | Tragic 13.1% |
| Panamanians | 6.6 /100 | #207 | Tragic 13.1% |
| Ugandans | 6.2 /100 | #208 | Tragic 13.1% |