Ethiopian vs Immigrants from Uganda Child Poverty Among Girls Under 16
COMPARE
Ethiopian
Immigrants from Uganda
Child Poverty Among Girls Under 16
Child Poverty Among Girls Under 16 Comparison
Ethiopians
Immigrants from Uganda
16.5%
CHILD POVERTY AMONG GIRLS UNDER 16
50.0/ 100
METRIC RATING
174th/ 347
METRIC RANK
16.8%
CHILD POVERTY AMONG GIRLS UNDER 16
31.3/ 100
METRIC RATING
192nd/ 347
METRIC RANK
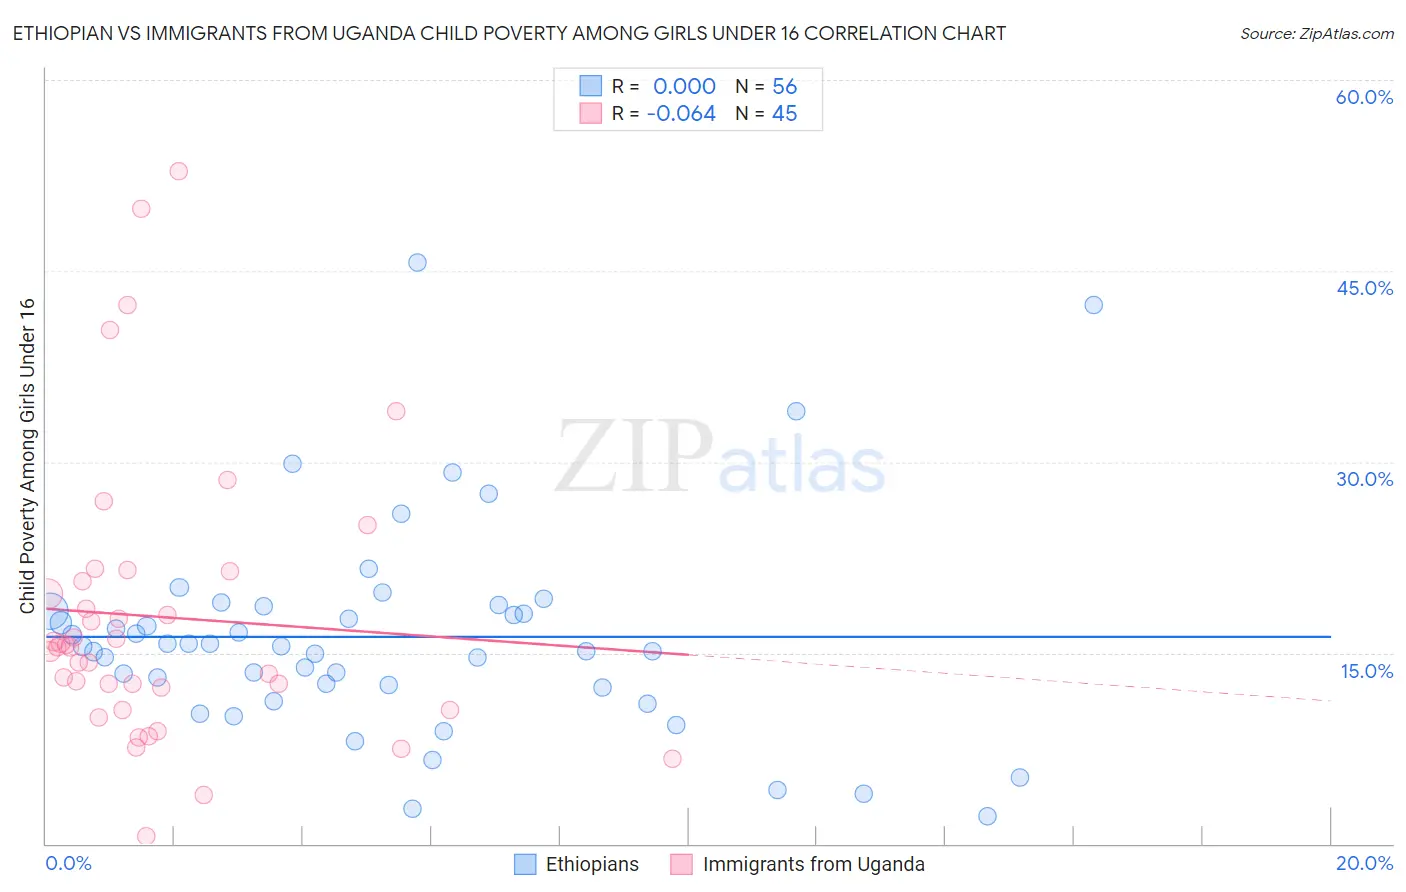
Ethiopian vs Immigrants from Uganda Child Poverty Among Girls Under 16 Correlation Chart
The statistical analysis conducted on geographies consisting of 221,230,982 people shows no correlation between the proportion of Ethiopians and poverty level among girls under the age of 16 in the United States with a correlation coefficient (R) of 0.000 and weighted average of 16.5%. Similarly, the statistical analysis conducted on geographies consisting of 125,221,716 people shows a slight negative correlation between the proportion of Immigrants from Uganda and poverty level among girls under the age of 16 in the United States with a correlation coefficient (R) of -0.064 and weighted average of 16.8%, a difference of 2.3%.
Child Poverty Among Girls Under 16 Correlation Summary
| Measurement | Ethiopian | Immigrants from Uganda |
| Minimum | 2.1% | 0.57% |
| Maximum | 45.6% | 52.8% |
| Range | 43.5% | 52.2% |
| Mean | 16.3% | 17.8% |
| Median | 15.5% | 15.5% |
| Interquartile 25% (IQ1) | 12.3% | 11.4% |
| Interquartile 75% (IQ3) | 18.5% | 21.0% |
| Interquartile Range (IQR) | 6.1% | 9.7% |
| Standard Deviation (Sample) | 8.3% | 11.1% |
| Standard Deviation (Population) | 8.3% | 11.0% |
Demographics Similar to Ethiopians and Immigrants from Uganda by Child Poverty Among Girls Under 16
In terms of child poverty among girls under 16, the demographic groups most similar to Ethiopians are Lebanese (16.6%, a difference of 0.53%), Hungarian (16.6%, a difference of 0.56%), Immigrants from South America (16.4%, a difference of 0.59%), Immigrants from Western Asia (16.6%, a difference of 0.68%), and White/Caucasian (16.6%, a difference of 0.73%). Similarly, the demographic groups most similar to Immigrants from Uganda are Immigrants from the Azores (16.8%, a difference of 0.010%), Kenyan (16.8%, a difference of 0.13%), Immigrants from Bosnia and Herzegovina (16.8%, a difference of 0.17%), Aleut (16.9%, a difference of 0.34%), and Arab (16.8%, a difference of 0.42%).
| Demographics | Rating | Rank | Child Poverty Among Girls Under 16 |
| Immigrants | South America | 55.1 /100 | #173 | Average 16.4% |
| Ethiopians | 50.0 /100 | #174 | Average 16.5% |
| Lebanese | 45.4 /100 | #175 | Average 16.6% |
| Hungarians | 45.1 /100 | #176 | Average 16.6% |
| Immigrants | Western Asia | 44.1 /100 | #177 | Average 16.6% |
| Whites/Caucasians | 43.6 /100 | #178 | Average 16.6% |
| Hawaiians | 43.4 /100 | #179 | Average 16.6% |
| Immigrants | Syria | 43.3 /100 | #180 | Average 16.6% |
| Immigrants | Iraq | 43.2 /100 | #181 | Average 16.6% |
| Immigrants | Ethiopia | 43.1 /100 | #182 | Average 16.6% |
| Immigrants | Portugal | 42.5 /100 | #183 | Average 16.6% |
| Scotch-Irish | 39.6 /100 | #184 | Fair 16.7% |
| Immigrants | Uruguay | 35.6 /100 | #185 | Fair 16.7% |
| South American Indians | 35.0 /100 | #186 | Fair 16.8% |
| Immigrants | Morocco | 34.6 /100 | #187 | Fair 16.8% |
| Arabs | 34.5 /100 | #188 | Fair 16.8% |
| Immigrants | Bosnia and Herzegovina | 32.5 /100 | #189 | Fair 16.8% |
| Kenyans | 32.3 /100 | #190 | Fair 16.8% |
| Immigrants | Azores | 31.3 /100 | #191 | Fair 16.8% |
| Immigrants | Uganda | 31.3 /100 | #192 | Fair 16.8% |
| Aleuts | 28.7 /100 | #193 | Fair 16.9% |