Ethiopian vs Immigrants from Uganda In Labor Force | Age 20-24
COMPARE
Ethiopian
Immigrants from Uganda
In Labor Force | Age 20-24
In Labor Force | Age 20-24 Comparison
Ethiopians
Immigrants from Uganda
77.3%
IN LABOR FORCE | AGE 20-24
100.0/ 100
METRIC RATING
47th/ 347
METRIC RANK
76.0%
IN LABOR FORCE | AGE 20-24
97.1/ 100
METRIC RATING
106th/ 347
METRIC RANK
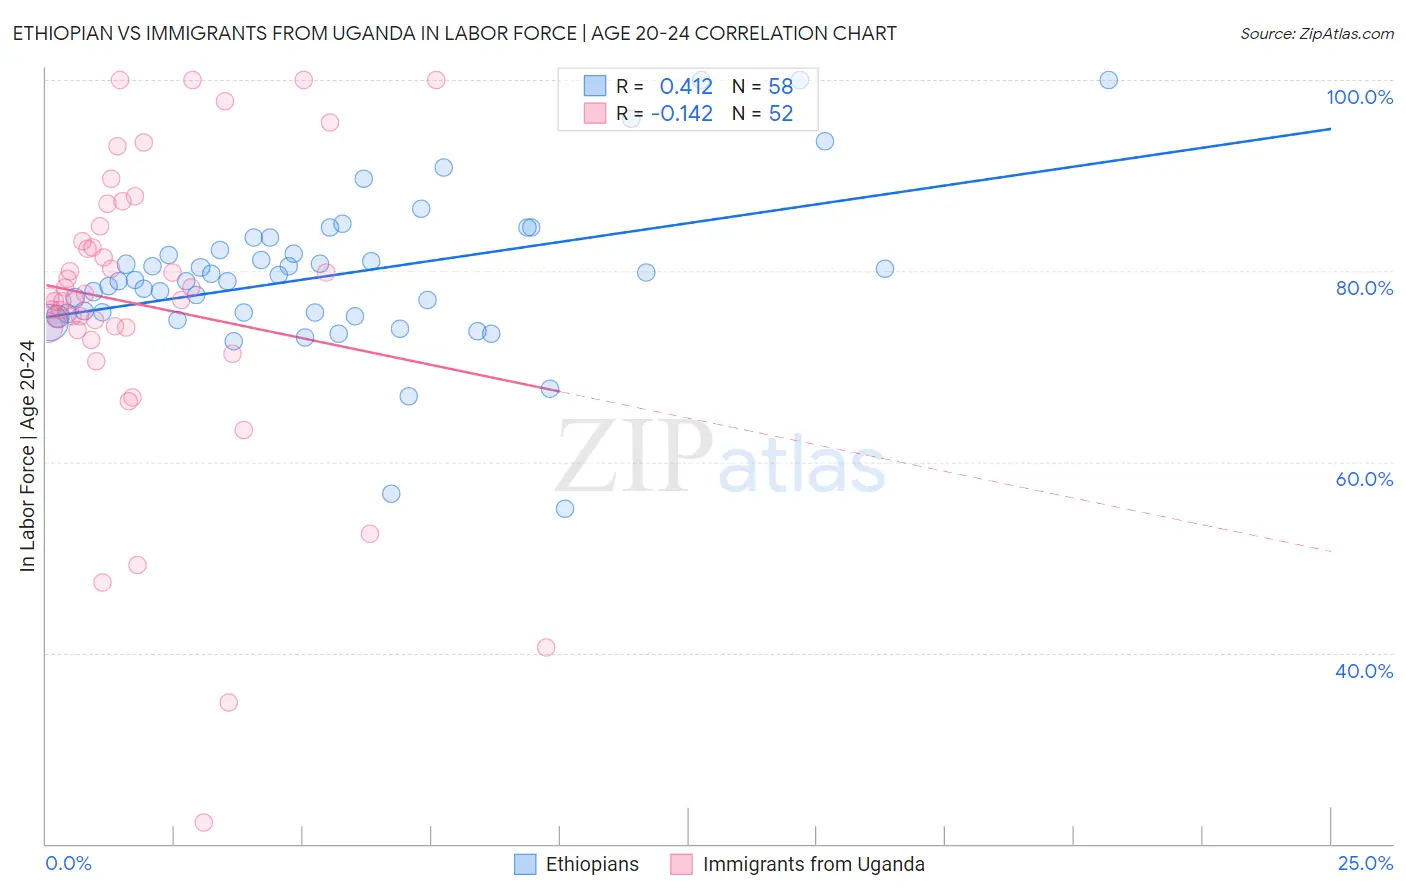
Ethiopian vs Immigrants from Uganda In Labor Force | Age 20-24 Correlation Chart
The statistical analysis conducted on geographies consisting of 223,247,985 people shows a moderate positive correlation between the proportion of Ethiopians and labor force participation rate among population between the ages 20 and 24 in the United States with a correlation coefficient (R) of 0.412 and weighted average of 77.3%. Similarly, the statistical analysis conducted on geographies consisting of 125,978,128 people shows a poor negative correlation between the proportion of Immigrants from Uganda and labor force participation rate among population between the ages 20 and 24 in the United States with a correlation coefficient (R) of -0.142 and weighted average of 76.0%, a difference of 1.7%.
In Labor Force | Age 20-24 Correlation Summary
| Measurement | Ethiopian | Immigrants from Uganda |
| Minimum | 55.1% | 22.2% |
| Maximum | 100.0% | 100.0% |
| Range | 44.9% | 77.8% |
| Mean | 79.6% | 76.3% |
| Median | 79.0% | 77.1% |
| Interquartile 25% (IQ1) | 75.5% | 73.9% |
| Interquartile 75% (IQ3) | 82.2% | 83.9% |
| Interquartile Range (IQR) | 6.7% | 10.0% |
| Standard Deviation (Sample) | 8.4% | 16.0% |
| Standard Deviation (Population) | 8.3% | 15.8% |
Similar Demographics by In Labor Force | Age 20-24
Demographics Similar to Ethiopians by In Labor Force | Age 20-24
In terms of in labor force | age 20-24, the demographic groups most similar to Ethiopians are Serbian (77.3%, a difference of 0.050%), Samoan (77.4%, a difference of 0.060%), Chinese (77.3%, a difference of 0.060%), Native Hawaiian (77.4%, a difference of 0.070%), and Fijian (77.4%, a difference of 0.080%).
| Demographics | Rating | Rank | In Labor Force | Age 20-24 |
| Scottish | 100.0 /100 | #40 | Exceptional 77.4% |
| Immigrants | Congo | 100.0 /100 | #41 | Exceptional 77.4% |
| French | 100.0 /100 | #42 | Exceptional 77.4% |
| Immigrants | Laos | 100.0 /100 | #43 | Exceptional 77.4% |
| Fijians | 100.0 /100 | #44 | Exceptional 77.4% |
| Native Hawaiians | 100.0 /100 | #45 | Exceptional 77.4% |
| Samoans | 100.0 /100 | #46 | Exceptional 77.4% |
| Ethiopians | 100.0 /100 | #47 | Exceptional 77.3% |
| Serbians | 100.0 /100 | #48 | Exceptional 77.3% |
| Chinese | 100.0 /100 | #49 | Exceptional 77.3% |
| Malaysians | 100.0 /100 | #50 | Exceptional 77.2% |
| Croatians | 100.0 /100 | #51 | Exceptional 77.2% |
| Indonesians | 100.0 /100 | #52 | Exceptional 77.2% |
| Immigrants | Azores | 100.0 /100 | #53 | Exceptional 77.2% |
| Celtics | 99.9 /100 | #54 | Exceptional 77.1% |
Demographics Similar to Immigrants from Uganda by In Labor Force | Age 20-24
In terms of in labor force | age 20-24, the demographic groups most similar to Immigrants from Uganda are Immigrants from Nepal (76.0%, a difference of 0.010%), Macedonian (76.0%, a difference of 0.020%), Greek (76.0%, a difference of 0.030%), Immigrants from North Macedonia (76.1%, a difference of 0.060%), and Iraqi (76.0%, a difference of 0.060%).
| Demographics | Rating | Rank | In Labor Force | Age 20-24 |
| Americans | 97.8 /100 | #99 | Exceptional 76.1% |
| Shoshone | 97.8 /100 | #100 | Exceptional 76.1% |
| Immigrants | Poland | 97.7 /100 | #101 | Exceptional 76.1% |
| Latvians | 97.6 /100 | #102 | Exceptional 76.1% |
| Immigrants | North Macedonia | 97.5 /100 | #103 | Exceptional 76.1% |
| Macedonians | 97.2 /100 | #104 | Exceptional 76.0% |
| Immigrants | Nepal | 97.2 /100 | #105 | Exceptional 76.0% |
| Immigrants | Uganda | 97.1 /100 | #106 | Exceptional 76.0% |
| Greeks | 96.9 /100 | #107 | Exceptional 76.0% |
| Iraqis | 96.6 /100 | #108 | Exceptional 76.0% |
| Cherokee | 95.8 /100 | #109 | Exceptional 75.9% |
| Immigrants | Morocco | 95.8 /100 | #110 | Exceptional 75.9% |
| Ukrainians | 95.7 /100 | #111 | Exceptional 75.9% |
| Immigrants | Canada | 95.6 /100 | #112 | Exceptional 75.9% |
| Immigrants | Netherlands | 95.3 /100 | #113 | Exceptional 75.9% |