Russian vs Immigrants from Uganda Poverty
COMPARE
Russian
Immigrants from Uganda
Poverty
Poverty Comparison
Russians
Immigrants from Uganda
10.9%
POVERTY
99.3/ 100
METRIC RATING
40th/ 347
METRIC RANK
12.8%
POVERTY
16.5/ 100
METRIC RATING
201st/ 347
METRIC RANK
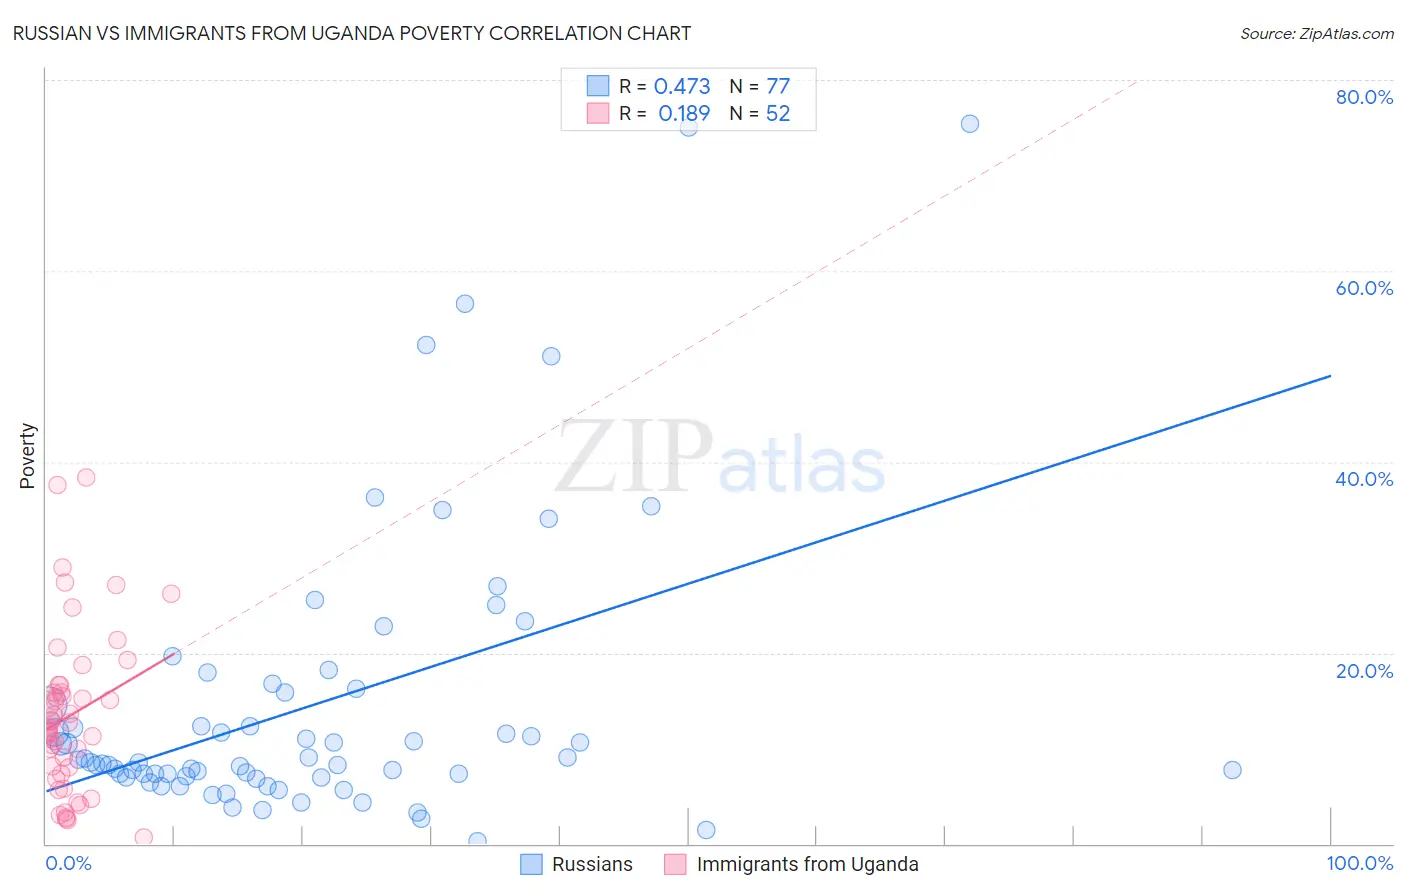
Russian vs Immigrants from Uganda Poverty Correlation Chart
The statistical analysis conducted on geographies consisting of 511,663,419 people shows a moderate positive correlation between the proportion of Russians and poverty level in the United States with a correlation coefficient (R) of 0.473 and weighted average of 10.9%. Similarly, the statistical analysis conducted on geographies consisting of 125,970,249 people shows a poor positive correlation between the proportion of Immigrants from Uganda and poverty level in the United States with a correlation coefficient (R) of 0.189 and weighted average of 12.8%, a difference of 18.0%.
Poverty Correlation Summary
| Measurement | Russian | Immigrants from Uganda |
| Minimum | 0.31% | 0.63% |
| Maximum | 75.4% | 38.4% |
| Range | 75.1% | 37.8% |
| Mean | 14.6% | 13.5% |
| Median | 8.6% | 12.4% |
| Interquartile 25% (IQ1) | 7.0% | 7.7% |
| Interquartile 75% (IQ3) | 16.1% | 16.2% |
| Interquartile Range (IQR) | 9.1% | 8.6% |
| Standard Deviation (Sample) | 15.1% | 8.5% |
| Standard Deviation (Population) | 15.0% | 8.4% |
Similar Demographics by Poverty
Demographics Similar to Russians by Poverty
In terms of poverty, the demographic groups most similar to Russians are Immigrants from Pakistan (10.8%, a difference of 0.050%), Immigrants from Iran (10.9%, a difference of 0.090%), Czech (10.8%, a difference of 0.13%), Immigrants from Greece (10.8%, a difference of 0.18%), and Cypriot (10.8%, a difference of 0.27%).
| Demographics | Rating | Rank | Poverty |
| Macedonians | 99.4 /100 | #33 | Exceptional 10.8% |
| Immigrants | Poland | 99.4 /100 | #34 | Exceptional 10.8% |
| Tongans | 99.4 /100 | #35 | Exceptional 10.8% |
| Cypriots | 99.3 /100 | #36 | Exceptional 10.8% |
| Immigrants | Greece | 99.3 /100 | #37 | Exceptional 10.8% |
| Czechs | 99.3 /100 | #38 | Exceptional 10.8% |
| Immigrants | Pakistan | 99.3 /100 | #39 | Exceptional 10.8% |
| Russians | 99.3 /100 | #40 | Exceptional 10.9% |
| Immigrants | Iran | 99.2 /100 | #41 | Exceptional 10.9% |
| Koreans | 99.2 /100 | #42 | Exceptional 10.9% |
| Immigrants | Singapore | 99.2 /100 | #43 | Exceptional 10.9% |
| Immigrants | Moldova | 99.1 /100 | #44 | Exceptional 10.9% |
| Turks | 98.9 /100 | #45 | Exceptional 11.0% |
| Immigrants | Czechoslovakia | 98.9 /100 | #46 | Exceptional 11.0% |
| Immigrants | Romania | 98.9 /100 | #47 | Exceptional 11.0% |
Demographics Similar to Immigrants from Uganda by Poverty
In terms of poverty, the demographic groups most similar to Immigrants from Uganda are Spaniard (12.8%, a difference of 0.0%), Immigrants from Kenya (12.8%, a difference of 0.16%), Immigrants from Uruguay (12.8%, a difference of 0.16%), Hmong (12.8%, a difference of 0.26%), and Immigrants from Lebanon (12.8%, a difference of 0.35%).
| Demographics | Rating | Rank | Poverty |
| Arabs | 21.1 /100 | #194 | Fair 12.7% |
| Immigrants | Kuwait | 20.9 /100 | #195 | Fair 12.7% |
| Iraqis | 20.8 /100 | #196 | Fair 12.7% |
| Immigrants | Lebanon | 18.7 /100 | #197 | Poor 12.8% |
| Spanish | 18.7 /100 | #198 | Poor 12.8% |
| Immigrants | Kenya | 17.5 /100 | #199 | Poor 12.8% |
| Spaniards | 16.5 /100 | #200 | Poor 12.8% |
| Immigrants | Uganda | 16.5 /100 | #201 | Poor 12.8% |
| Immigrants | Uruguay | 15.6 /100 | #202 | Poor 12.8% |
| Hmong | 15.0 /100 | #203 | Poor 12.8% |
| Immigrants | Western Asia | 14.1 /100 | #204 | Poor 12.9% |
| Tsimshian | 9.2 /100 | #205 | Tragic 13.0% |
| Immigrants | Eastern Africa | 7.0 /100 | #206 | Tragic 13.1% |
| Panamanians | 6.6 /100 | #207 | Tragic 13.1% |
| Ugandans | 6.2 /100 | #208 | Tragic 13.1% |