Mongolian vs Immigrants from Uganda Poverty
COMPARE
Mongolian
Immigrants from Uganda
Poverty
Poverty Comparison
Mongolians
Immigrants from Uganda
12.4%
POVERTY
43.6/ 100
METRIC RATING
180th/ 347
METRIC RANK
12.8%
POVERTY
16.5/ 100
METRIC RATING
201st/ 347
METRIC RANK
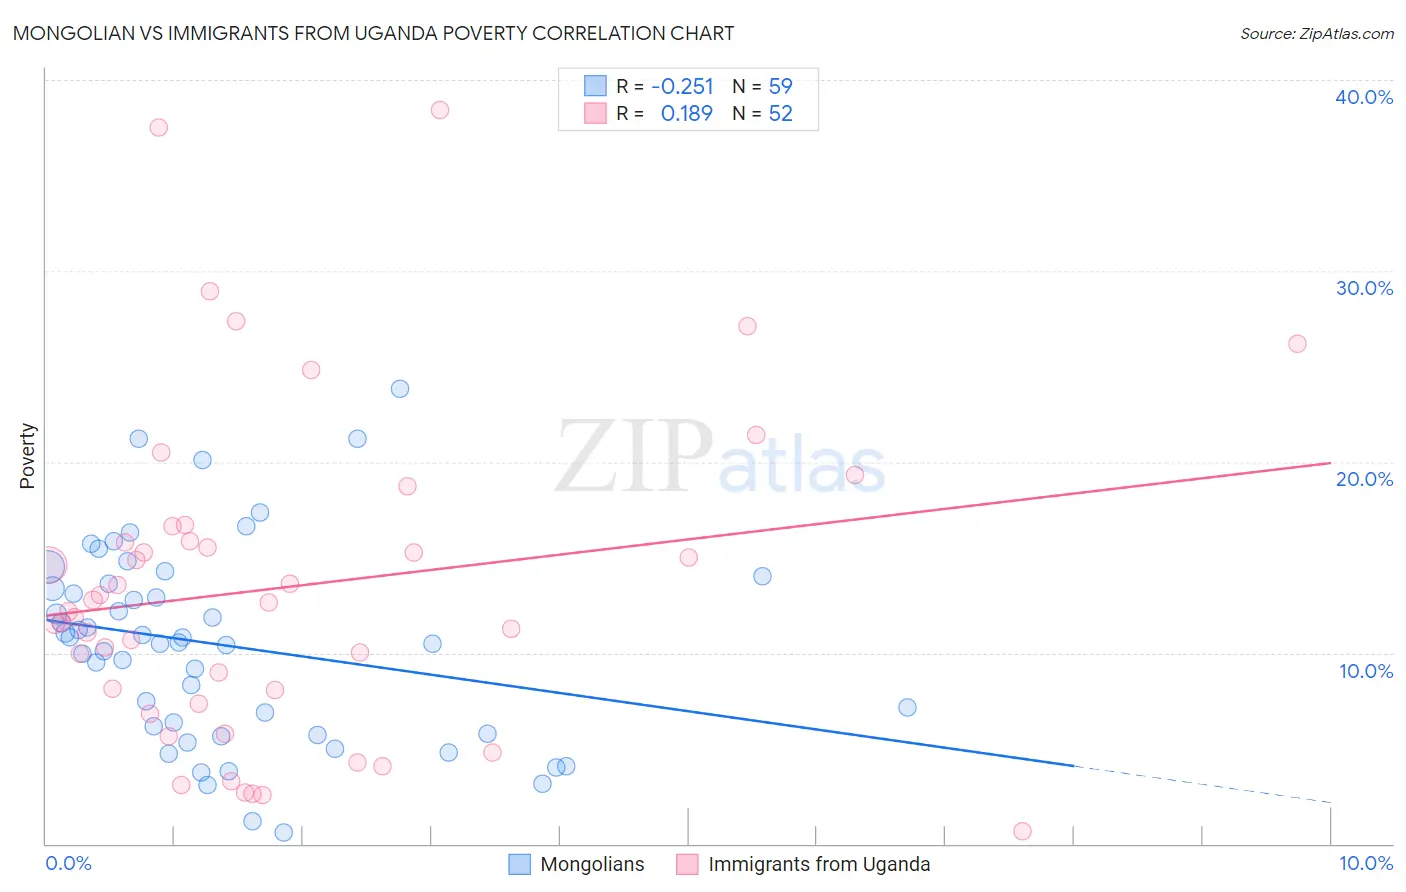
Mongolian vs Immigrants from Uganda Poverty Correlation Chart
The statistical analysis conducted on geographies consisting of 140,290,240 people shows a weak negative correlation between the proportion of Mongolians and poverty level in the United States with a correlation coefficient (R) of -0.251 and weighted average of 12.4%. Similarly, the statistical analysis conducted on geographies consisting of 125,970,249 people shows a poor positive correlation between the proportion of Immigrants from Uganda and poverty level in the United States with a correlation coefficient (R) of 0.189 and weighted average of 12.8%, a difference of 3.3%.
Poverty Correlation Summary
| Measurement | Mongolian | Immigrants from Uganda |
| Minimum | 0.57% | 0.63% |
| Maximum | 23.9% | 38.4% |
| Range | 23.3% | 37.8% |
| Mean | 10.4% | 13.5% |
| Median | 10.6% | 12.4% |
| Interquartile 25% (IQ1) | 5.7% | 7.7% |
| Interquartile 75% (IQ3) | 13.6% | 16.2% |
| Interquartile Range (IQR) | 7.9% | 8.6% |
| Standard Deviation (Sample) | 5.2% | 8.5% |
| Standard Deviation (Population) | 5.1% | 8.4% |
Similar Demographics by Poverty
Demographics Similar to Mongolians by Poverty
In terms of poverty, the demographic groups most similar to Mongolians are Immigrants from Morocco (12.4%, a difference of 0.040%), Uruguayan (12.4%, a difference of 0.10%), Immigrants from Afghanistan (12.4%, a difference of 0.15%), Immigrants from Cameroon (12.4%, a difference of 0.19%), and Immigrants from Iraq (12.4%, a difference of 0.34%).
| Demographics | Rating | Rank | Poverty |
| Celtics | 50.1 /100 | #173 | Average 12.3% |
| Lebanese | 50.0 /100 | #174 | Average 12.3% |
| South Americans | 48.7 /100 | #175 | Average 12.3% |
| Immigrants | Colombia | 47.7 /100 | #176 | Average 12.3% |
| Immigrants | Syria | 47.5 /100 | #177 | Average 12.3% |
| Uruguayans | 44.7 /100 | #178 | Average 12.4% |
| Immigrants | Morocco | 44.0 /100 | #179 | Average 12.4% |
| Mongolians | 43.6 /100 | #180 | Average 12.4% |
| Immigrants | Afghanistan | 42.1 /100 | #181 | Average 12.4% |
| Immigrants | Cameroon | 41.7 /100 | #182 | Average 12.4% |
| Immigrants | Iraq | 40.2 /100 | #183 | Average 12.4% |
| Kenyans | 38.8 /100 | #184 | Fair 12.5% |
| Israelis | 36.4 /100 | #185 | Fair 12.5% |
| Immigrants | Sierra Leone | 36.3 /100 | #186 | Fair 12.5% |
| Hawaiians | 34.1 /100 | #187 | Fair 12.5% |
Demographics Similar to Immigrants from Uganda by Poverty
In terms of poverty, the demographic groups most similar to Immigrants from Uganda are Spaniard (12.8%, a difference of 0.0%), Immigrants from Kenya (12.8%, a difference of 0.16%), Immigrants from Uruguay (12.8%, a difference of 0.16%), Hmong (12.8%, a difference of 0.26%), and Immigrants from Lebanon (12.8%, a difference of 0.35%).
| Demographics | Rating | Rank | Poverty |
| Arabs | 21.1 /100 | #194 | Fair 12.7% |
| Immigrants | Kuwait | 20.9 /100 | #195 | Fair 12.7% |
| Iraqis | 20.8 /100 | #196 | Fair 12.7% |
| Immigrants | Lebanon | 18.7 /100 | #197 | Poor 12.8% |
| Spanish | 18.7 /100 | #198 | Poor 12.8% |
| Immigrants | Kenya | 17.5 /100 | #199 | Poor 12.8% |
| Spaniards | 16.5 /100 | #200 | Poor 12.8% |
| Immigrants | Uganda | 16.5 /100 | #201 | Poor 12.8% |
| Immigrants | Uruguay | 15.6 /100 | #202 | Poor 12.8% |
| Hmong | 15.0 /100 | #203 | Poor 12.8% |
| Immigrants | Western Asia | 14.1 /100 | #204 | Poor 12.9% |
| Tsimshian | 9.2 /100 | #205 | Tragic 13.0% |
| Immigrants | Eastern Africa | 7.0 /100 | #206 | Tragic 13.1% |
| Panamanians | 6.6 /100 | #207 | Tragic 13.1% |
| Ugandans | 6.2 /100 | #208 | Tragic 13.1% |