Ethiopian vs Immigrants from Kuwait Single Father Poverty
COMPARE
Ethiopian
Immigrants from Kuwait
Single Father Poverty
Single Father Poverty Comparison
Ethiopians
Immigrants from Kuwait
13.5%
SINGLE FATHER POVERTY
100.0/ 100
METRIC RATING
6th/ 347
METRIC RANK
16.0%
SINGLE FATHER POVERTY
81.4/ 100
METRIC RATING
144th/ 347
METRIC RANK
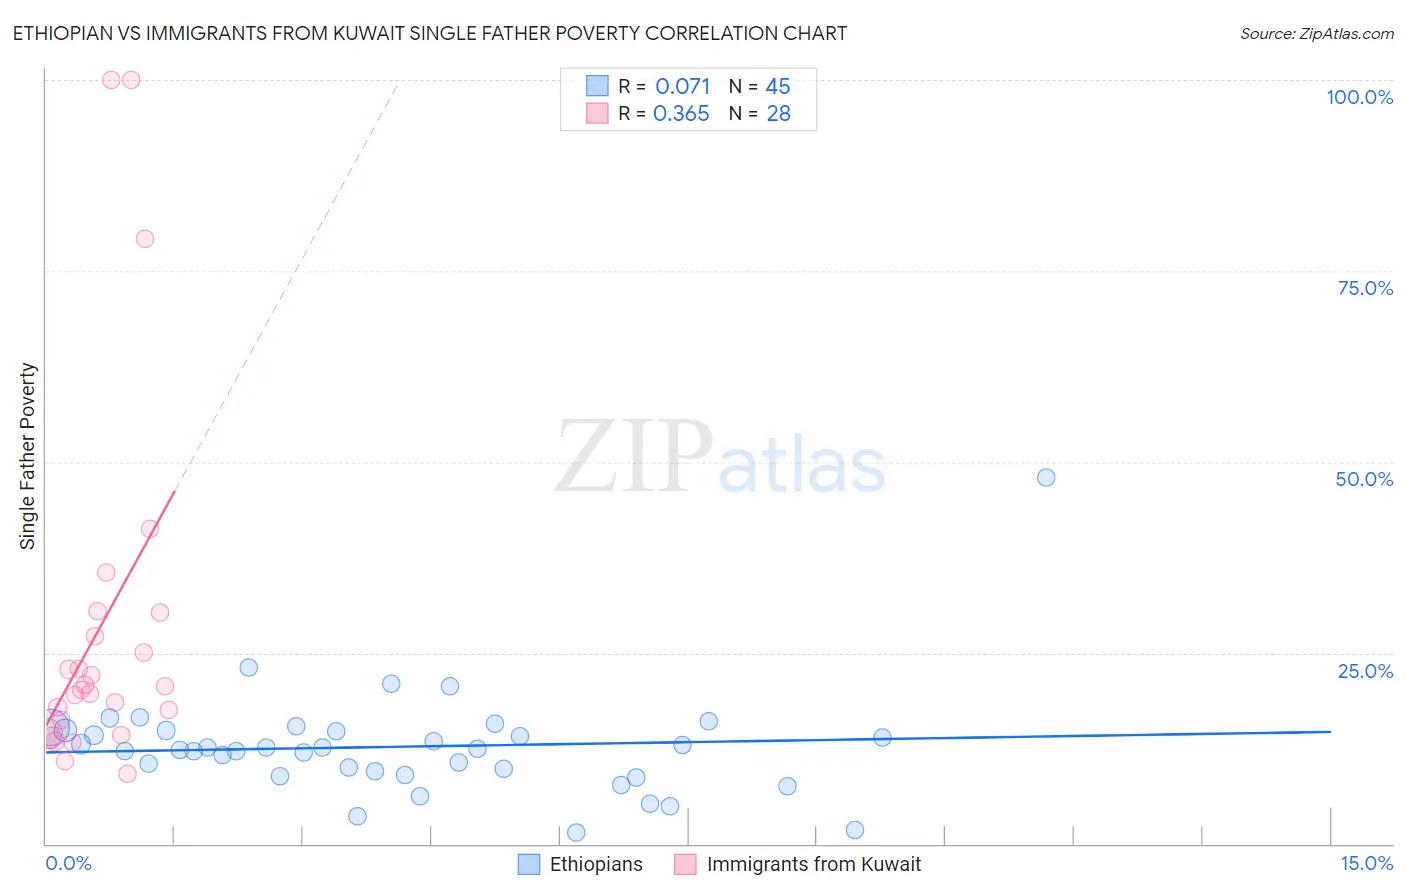
Ethiopian vs Immigrants from Kuwait Single Father Poverty Correlation Chart
The statistical analysis conducted on geographies consisting of 191,994,116 people shows a slight positive correlation between the proportion of Ethiopians and poverty level among single fathers in the United States with a correlation coefficient (R) of 0.071 and weighted average of 13.5%. Similarly, the statistical analysis conducted on geographies consisting of 120,904,433 people shows a mild positive correlation between the proportion of Immigrants from Kuwait and poverty level among single fathers in the United States with a correlation coefficient (R) of 0.365 and weighted average of 16.0%, a difference of 18.3%.
Single Father Poverty Correlation Summary
| Measurement | Ethiopian | Immigrants from Kuwait |
| Minimum | 1.5% | 9.1% |
| Maximum | 48.0% | 100.0% |
| Range | 46.5% | 90.9% |
| Mean | 12.7% | 28.5% |
| Median | 12.4% | 20.4% |
| Interquartile 25% (IQ1) | 9.3% | 15.3% |
| Interquartile 75% (IQ3) | 14.8% | 28.8% |
| Interquartile Range (IQR) | 5.6% | 13.4% |
| Standard Deviation (Sample) | 7.0% | 24.1% |
| Standard Deviation (Population) | 7.0% | 23.7% |
Similar Demographics by Single Father Poverty
Demographics Similar to Ethiopians by Single Father Poverty
In terms of single father poverty, the demographic groups most similar to Ethiopians are Immigrants from Ethiopia (13.4%, a difference of 0.77%), Immigrants from Taiwan (13.7%, a difference of 1.1%), Samoan (13.8%, a difference of 1.9%), Immigrants from Fiji (13.2%, a difference of 2.3%), and Afghan (14.0%, a difference of 3.0%).
| Demographics | Rating | Rank | Single Father Poverty |
| Assyrians/Chaldeans/Syriacs | 100.0 /100 | #1 | Exceptional 11.7% |
| Tongans | 100.0 /100 | #2 | Exceptional 12.2% |
| Tsimshian | 100.0 /100 | #3 | Exceptional 12.7% |
| Immigrants | Fiji | 100.0 /100 | #4 | Exceptional 13.2% |
| Immigrants | Ethiopia | 100.0 /100 | #5 | Exceptional 13.4% |
| Ethiopians | 100.0 /100 | #6 | Exceptional 13.5% |
| Immigrants | Taiwan | 100.0 /100 | #7 | Exceptional 13.7% |
| Samoans | 100.0 /100 | #8 | Exceptional 13.8% |
| Afghans | 100.0 /100 | #9 | Exceptional 14.0% |
| Koreans | 100.0 /100 | #10 | Exceptional 14.0% |
| Filipinos | 100.0 /100 | #11 | Exceptional 14.0% |
| Immigrants | India | 100.0 /100 | #12 | Exceptional 14.0% |
| Immigrants | Philippines | 100.0 /100 | #13 | Exceptional 14.0% |
| Immigrants | Vietnam | 100.0 /100 | #14 | Exceptional 14.1% |
| Sri Lankans | 100.0 /100 | #15 | Exceptional 14.2% |
Demographics Similar to Immigrants from Kuwait by Single Father Poverty
In terms of single father poverty, the demographic groups most similar to Immigrants from Kuwait are Immigrants from Western Asia (16.0%, a difference of 0.050%), Immigrants from Central America (16.0%, a difference of 0.13%), Liberian (16.0%, a difference of 0.15%), Immigrants from Mexico (16.0%, a difference of 0.15%), and Immigrants from Hungary (16.1%, a difference of 0.22%).
| Demographics | Rating | Rank | Single Father Poverty |
| Immigrants | Azores | 87.2 /100 | #137 | Excellent 15.9% |
| Central Americans | 87.1 /100 | #138 | Excellent 16.0% |
| South Americans | 85.9 /100 | #139 | Excellent 16.0% |
| Immigrants | Netherlands | 85.3 /100 | #140 | Excellent 16.0% |
| Liberians | 83.3 /100 | #141 | Excellent 16.0% |
| Immigrants | Mexico | 83.3 /100 | #142 | Excellent 16.0% |
| Immigrants | Central America | 83.1 /100 | #143 | Excellent 16.0% |
| Immigrants | Kuwait | 81.4 /100 | #144 | Excellent 16.0% |
| Immigrants | Western Asia | 80.7 /100 | #145 | Excellent 16.0% |
| Immigrants | Hungary | 78.3 /100 | #146 | Good 16.1% |
| Colombians | 77.1 /100 | #147 | Good 16.1% |
| Nigerians | 76.8 /100 | #148 | Good 16.1% |
| South Africans | 75.1 /100 | #149 | Good 16.1% |
| Jordanians | 74.2 /100 | #150 | Good 16.1% |
| Immigrants | France | 73.1 /100 | #151 | Good 16.1% |