Ethiopian vs Immigrants from Kuwait Family Households
COMPARE
Ethiopian
Immigrants from Kuwait
Family Households
Family Households Comparison
Ethiopians
Immigrants from Kuwait
61.2%
FAMILY HOUSEHOLDS
0.0/ 100
METRIC RATING
332nd/ 347
METRIC RANK
62.4%
FAMILY HOUSEHOLDS
0.0/ 100
METRIC RATING
299th/ 347
METRIC RANK
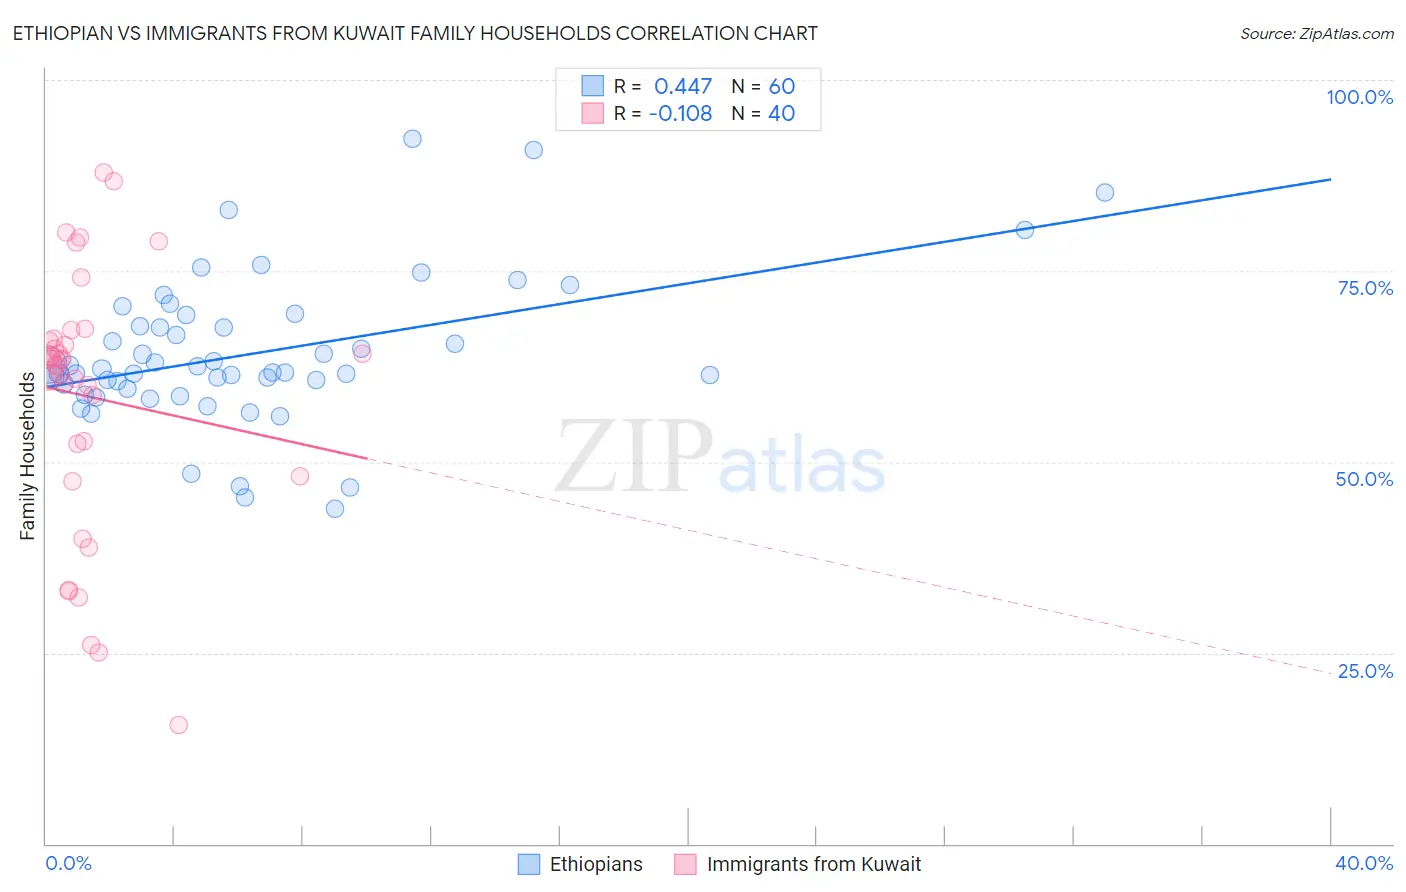
Ethiopian vs Immigrants from Kuwait Family Households Correlation Chart
The statistical analysis conducted on geographies consisting of 223,101,453 people shows a moderate positive correlation between the proportion of Ethiopians and percentage of family households in the United States with a correlation coefficient (R) of 0.447 and weighted average of 61.2%. Similarly, the statistical analysis conducted on geographies consisting of 136,888,250 people shows a poor negative correlation between the proportion of Immigrants from Kuwait and percentage of family households in the United States with a correlation coefficient (R) of -0.108 and weighted average of 62.4%, a difference of 1.8%.
Family Households Correlation Summary
| Measurement | Ethiopian | Immigrants from Kuwait |
| Minimum | 43.8% | 15.6% |
| Maximum | 92.3% | 87.9% |
| Range | 48.5% | 72.2% |
| Mean | 64.2% | 58.5% |
| Median | 62.0% | 63.0% |
| Interquartile 25% (IQ1) | 59.9% | 50.2% |
| Interquartile 75% (IQ3) | 68.5% | 66.0% |
| Interquartile Range (IQR) | 8.6% | 15.8% |
| Standard Deviation (Sample) | 9.7% | 17.0% |
| Standard Deviation (Population) | 9.6% | 16.8% |
Similar Demographics by Family Households
Demographics Similar to Ethiopians by Family Households
In terms of family households, the demographic groups most similar to Ethiopians are Immigrants from France (61.3%, a difference of 0.070%), Immigrants from Australia (61.3%, a difference of 0.080%), Immigrants from Ethiopia (61.2%, a difference of 0.080%), Immigrants from Eastern Africa (61.1%, a difference of 0.16%), and Cambodian (61.4%, a difference of 0.21%).
| Demographics | Rating | Rank | Family Households |
| Immigrants | Switzerland | 0.0 /100 | #325 | Tragic 61.6% |
| Indonesians | 0.0 /100 | #326 | Tragic 61.5% |
| Blacks/African Americans | 0.0 /100 | #327 | Tragic 61.5% |
| Kiowa | 0.0 /100 | #328 | Tragic 61.4% |
| Cambodians | 0.0 /100 | #329 | Tragic 61.4% |
| Immigrants | Australia | 0.0 /100 | #330 | Tragic 61.3% |
| Immigrants | France | 0.0 /100 | #331 | Tragic 61.3% |
| Ethiopians | 0.0 /100 | #332 | Tragic 61.2% |
| Immigrants | Ethiopia | 0.0 /100 | #333 | Tragic 61.2% |
| Immigrants | Eastern Africa | 0.0 /100 | #334 | Tragic 61.1% |
| Carpatho Rusyns | 0.0 /100 | #335 | Tragic 61.1% |
| German Russians | 0.0 /100 | #336 | Tragic 60.9% |
| Soviet Union | 0.0 /100 | #337 | Tragic 60.9% |
| Immigrants | Eritrea | 0.0 /100 | #338 | Tragic 60.8% |
| Immigrants | Saudi Arabia | 0.0 /100 | #339 | Tragic 60.7% |
Demographics Similar to Immigrants from Kuwait by Family Households
In terms of family households, the demographic groups most similar to Immigrants from Kuwait are Immigrants from Africa (62.4%, a difference of 0.0%), Immigrants from Albania (62.4%, a difference of 0.030%), Immigrants from Spain (62.4%, a difference of 0.060%), Immigrants from Kenya (62.3%, a difference of 0.070%), and French American Indian (62.4%, a difference of 0.090%).
| Demographics | Rating | Rank | Family Households |
| Immigrants | Burma/Myanmar | 0.0 /100 | #292 | Tragic 62.6% |
| Immigrants | Sweden | 0.0 /100 | #293 | Tragic 62.5% |
| Barbadians | 0.0 /100 | #294 | Tragic 62.5% |
| Okinawans | 0.0 /100 | #295 | Tragic 62.5% |
| Slovenes | 0.0 /100 | #296 | Tragic 62.4% |
| French American Indians | 0.0 /100 | #297 | Tragic 62.4% |
| Immigrants | Spain | 0.0 /100 | #298 | Tragic 62.4% |
| Immigrants | Kuwait | 0.0 /100 | #299 | Tragic 62.4% |
| Immigrants | Africa | 0.0 /100 | #300 | Tragic 62.4% |
| Immigrants | Albania | 0.0 /100 | #301 | Tragic 62.4% |
| Immigrants | Kenya | 0.0 /100 | #302 | Tragic 62.3% |
| Cree | 0.0 /100 | #303 | Tragic 62.3% |
| Iroquois | 0.0 /100 | #304 | Tragic 62.2% |
| Bermudans | 0.0 /100 | #305 | Tragic 62.2% |
| Africans | 0.0 /100 | #306 | Tragic 62.1% |