Seminole vs Immigrants from Kuwait Poverty
COMPARE
Seminole
Immigrants from Kuwait
Poverty
Poverty Comparison
Seminole
Immigrants from Kuwait
15.6%
POVERTY
0.0/ 100
METRIC RATING
309th/ 347
METRIC RANK
12.7%
POVERTY
20.9/ 100
METRIC RATING
195th/ 347
METRIC RANK
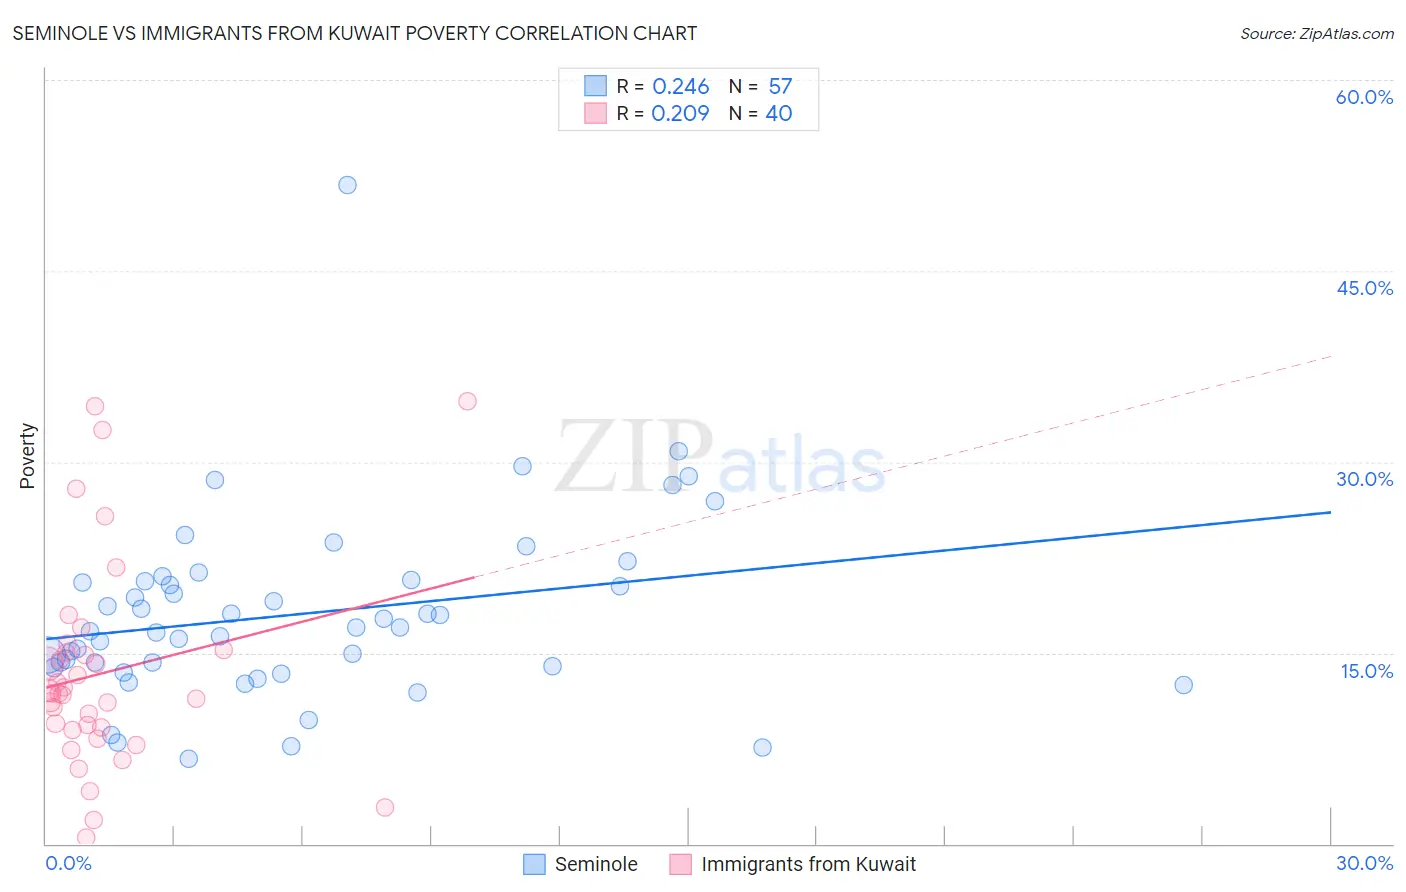
Seminole vs Immigrants from Kuwait Poverty Correlation Chart
The statistical analysis conducted on geographies consisting of 118,300,623 people shows a weak positive correlation between the proportion of Seminole and poverty level in the United States with a correlation coefficient (R) of 0.246 and weighted average of 15.6%. Similarly, the statistical analysis conducted on geographies consisting of 136,889,651 people shows a weak positive correlation between the proportion of Immigrants from Kuwait and poverty level in the United States with a correlation coefficient (R) of 0.209 and weighted average of 12.7%, a difference of 22.8%.
Poverty Correlation Summary
| Measurement | Seminole | Immigrants from Kuwait |
| Minimum | 6.7% | 0.47% |
| Maximum | 51.8% | 34.8% |
| Range | 45.1% | 34.3% |
| Mean | 18.0% | 13.4% |
| Median | 16.9% | 11.8% |
| Interquartile 25% (IQ1) | 13.9% | 9.0% |
| Interquartile 75% (IQ3) | 20.7% | 15.1% |
| Interquartile Range (IQR) | 6.8% | 6.1% |
| Standard Deviation (Sample) | 7.3% | 8.1% |
| Standard Deviation (Population) | 7.2% | 8.0% |
Similar Demographics by Poverty
Demographics Similar to Seminole by Poverty
In terms of poverty, the demographic groups most similar to Seminole are Choctaw (15.6%, a difference of 0.040%), Dutch West Indian (15.6%, a difference of 0.090%), African (15.6%, a difference of 0.15%), Creek (15.6%, a difference of 0.23%), and Chippewa (15.7%, a difference of 0.48%).
| Demographics | Rating | Rank | Poverty |
| Somalis | 0.0 /100 | #302 | Tragic 15.4% |
| Immigrants | Caribbean | 0.0 /100 | #303 | Tragic 15.5% |
| Immigrants | Mexico | 0.0 /100 | #304 | Tragic 15.5% |
| Immigrants | Guatemala | 0.0 /100 | #305 | Tragic 15.5% |
| Creek | 0.0 /100 | #306 | Tragic 15.6% |
| Africans | 0.0 /100 | #307 | Tragic 15.6% |
| Choctaw | 0.0 /100 | #308 | Tragic 15.6% |
| Seminole | 0.0 /100 | #309 | Tragic 15.6% |
| Dutch West Indians | 0.0 /100 | #310 | Tragic 15.6% |
| Chippewa | 0.0 /100 | #311 | Tragic 15.7% |
| Cajuns | 0.0 /100 | #312 | Tragic 15.7% |
| Immigrants | Grenada | 0.0 /100 | #313 | Tragic 15.8% |
| Immigrants | Somalia | 0.0 /100 | #314 | Tragic 15.8% |
| British West Indians | 0.0 /100 | #315 | Tragic 15.9% |
| Hondurans | 0.0 /100 | #316 | Tragic 15.9% |
Demographics Similar to Immigrants from Kuwait by Poverty
In terms of poverty, the demographic groups most similar to Immigrants from Kuwait are Iraqi (12.7%, a difference of 0.020%), Arab (12.7%, a difference of 0.030%), Delaware (12.7%, a difference of 0.080%), Immigrants from Lebanon (12.8%, a difference of 0.32%), and South American Indian (12.7%, a difference of 0.33%).
| Demographics | Rating | Rank | Poverty |
| Immigrants | Costa Rica | 33.3 /100 | #188 | Fair 12.5% |
| Aleuts | 33.2 /100 | #189 | Fair 12.5% |
| Immigrants | South America | 32.3 /100 | #190 | Fair 12.5% |
| Sierra Leoneans | 31.5 /100 | #191 | Fair 12.6% |
| South American Indians | 23.3 /100 | #192 | Fair 12.7% |
| Delaware | 21.4 /100 | #193 | Fair 12.7% |
| Arabs | 21.1 /100 | #194 | Fair 12.7% |
| Immigrants | Kuwait | 20.9 /100 | #195 | Fair 12.7% |
| Iraqis | 20.8 /100 | #196 | Fair 12.7% |
| Immigrants | Lebanon | 18.7 /100 | #197 | Poor 12.8% |
| Spanish | 18.7 /100 | #198 | Poor 12.8% |
| Immigrants | Kenya | 17.5 /100 | #199 | Poor 12.8% |
| Spaniards | 16.5 /100 | #200 | Poor 12.8% |
| Immigrants | Uganda | 16.5 /100 | #201 | Poor 12.8% |
| Immigrants | Uruguay | 15.6 /100 | #202 | Poor 12.8% |