Immigrants from Vietnam vs Immigrants from Kuwait Poverty
COMPARE
Immigrants from Vietnam
Immigrants from Kuwait
Poverty
Poverty Comparison
Immigrants from Vietnam
Immigrants from Kuwait
11.8%
POVERTY
85.2/ 100
METRIC RATING
135th/ 347
METRIC RANK
12.7%
POVERTY
20.9/ 100
METRIC RATING
195th/ 347
METRIC RANK
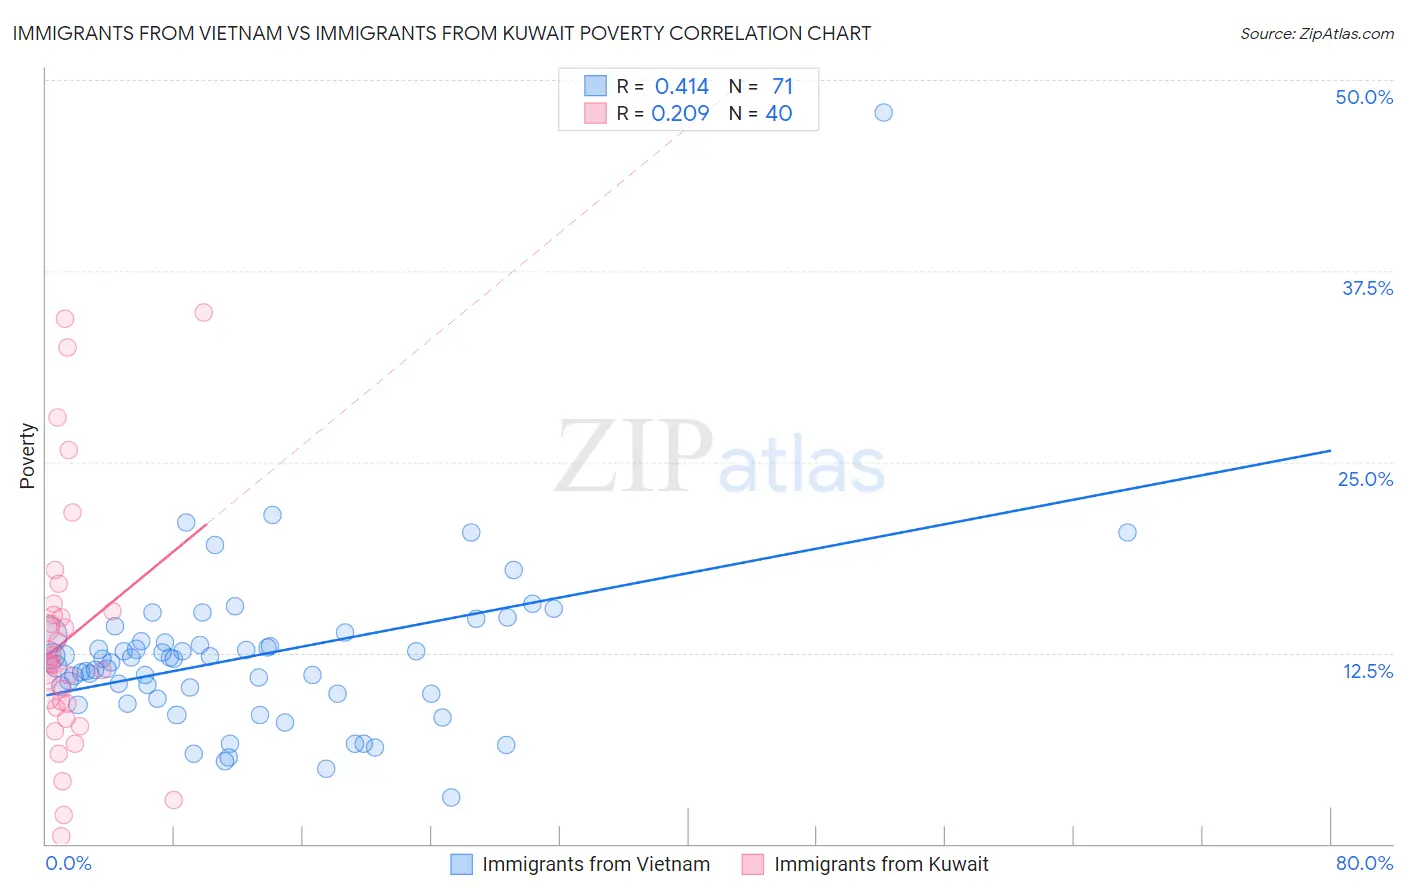
Immigrants from Vietnam vs Immigrants from Kuwait Poverty Correlation Chart
The statistical analysis conducted on geographies consisting of 404,593,024 people shows a moderate positive correlation between the proportion of Immigrants from Vietnam and poverty level in the United States with a correlation coefficient (R) of 0.414 and weighted average of 11.8%. Similarly, the statistical analysis conducted on geographies consisting of 136,889,651 people shows a weak positive correlation between the proportion of Immigrants from Kuwait and poverty level in the United States with a correlation coefficient (R) of 0.209 and weighted average of 12.7%, a difference of 7.8%.
Poverty Correlation Summary
| Measurement | Immigrants from Vietnam | Immigrants from Kuwait |
| Minimum | 3.0% | 0.47% |
| Maximum | 47.9% | 34.8% |
| Range | 44.9% | 34.3% |
| Mean | 12.3% | 13.4% |
| Median | 12.1% | 11.8% |
| Interquartile 25% (IQ1) | 9.8% | 9.0% |
| Interquartile 75% (IQ3) | 13.2% | 15.1% |
| Interquartile Range (IQR) | 3.4% | 6.1% |
| Standard Deviation (Sample) | 5.7% | 8.1% |
| Standard Deviation (Population) | 5.7% | 8.0% |
Similar Demographics by Poverty
Demographics Similar to Immigrants from Vietnam by Poverty
In terms of poverty, the demographic groups most similar to Immigrants from Vietnam are Yugoslavian (11.8%, a difference of 0.010%), Immigrants from Western Europe (11.8%, a difference of 0.020%), Peruvian (11.8%, a difference of 0.090%), Chilean (11.8%, a difference of 0.19%), and French (11.8%, a difference of 0.20%).
| Demographics | Rating | Rank | Poverty |
| Immigrants | Israel | 87.4 /100 | #128 | Excellent 11.7% |
| South Africans | 87.0 /100 | #129 | Excellent 11.7% |
| Immigrants | Ukraine | 86.6 /100 | #130 | Excellent 11.8% |
| French | 86.1 /100 | #131 | Excellent 11.8% |
| Peruvians | 85.6 /100 | #132 | Excellent 11.8% |
| Immigrants | Western Europe | 85.2 /100 | #133 | Excellent 11.8% |
| Yugoslavians | 85.2 /100 | #134 | Excellent 11.8% |
| Immigrants | Vietnam | 85.2 /100 | #135 | Excellent 11.8% |
| Chileans | 84.2 /100 | #136 | Excellent 11.8% |
| Immigrants | Switzerland | 83.0 /100 | #137 | Excellent 11.8% |
| Immigrants | Jordan | 82.4 /100 | #138 | Excellent 11.9% |
| Pakistanis | 82.2 /100 | #139 | Excellent 11.9% |
| Immigrants | Peru | 81.1 /100 | #140 | Excellent 11.9% |
| Immigrants | France | 80.5 /100 | #141 | Excellent 11.9% |
| Basques | 80.4 /100 | #142 | Excellent 11.9% |
Demographics Similar to Immigrants from Kuwait by Poverty
In terms of poverty, the demographic groups most similar to Immigrants from Kuwait are Iraqi (12.7%, a difference of 0.020%), Arab (12.7%, a difference of 0.030%), Delaware (12.7%, a difference of 0.080%), Immigrants from Lebanon (12.8%, a difference of 0.32%), and South American Indian (12.7%, a difference of 0.33%).
| Demographics | Rating | Rank | Poverty |
| Immigrants | Costa Rica | 33.3 /100 | #188 | Fair 12.5% |
| Aleuts | 33.2 /100 | #189 | Fair 12.5% |
| Immigrants | South America | 32.3 /100 | #190 | Fair 12.5% |
| Sierra Leoneans | 31.5 /100 | #191 | Fair 12.6% |
| South American Indians | 23.3 /100 | #192 | Fair 12.7% |
| Delaware | 21.4 /100 | #193 | Fair 12.7% |
| Arabs | 21.1 /100 | #194 | Fair 12.7% |
| Immigrants | Kuwait | 20.9 /100 | #195 | Fair 12.7% |
| Iraqis | 20.8 /100 | #196 | Fair 12.7% |
| Immigrants | Lebanon | 18.7 /100 | #197 | Poor 12.8% |
| Spanish | 18.7 /100 | #198 | Poor 12.8% |
| Immigrants | Kenya | 17.5 /100 | #199 | Poor 12.8% |
| Spaniards | 16.5 /100 | #200 | Poor 12.8% |
| Immigrants | Uganda | 16.5 /100 | #201 | Poor 12.8% |
| Immigrants | Uruguay | 15.6 /100 | #202 | Poor 12.8% |