Immigrants from Nicaragua vs Immigrants from Kuwait Poverty
COMPARE
Immigrants from Nicaragua
Immigrants from Kuwait
Poverty
Poverty Comparison
Immigrants from Nicaragua
Immigrants from Kuwait
14.3%
POVERTY
0.1/ 100
METRIC RATING
259th/ 347
METRIC RANK
12.7%
POVERTY
20.9/ 100
METRIC RATING
195th/ 347
METRIC RANK
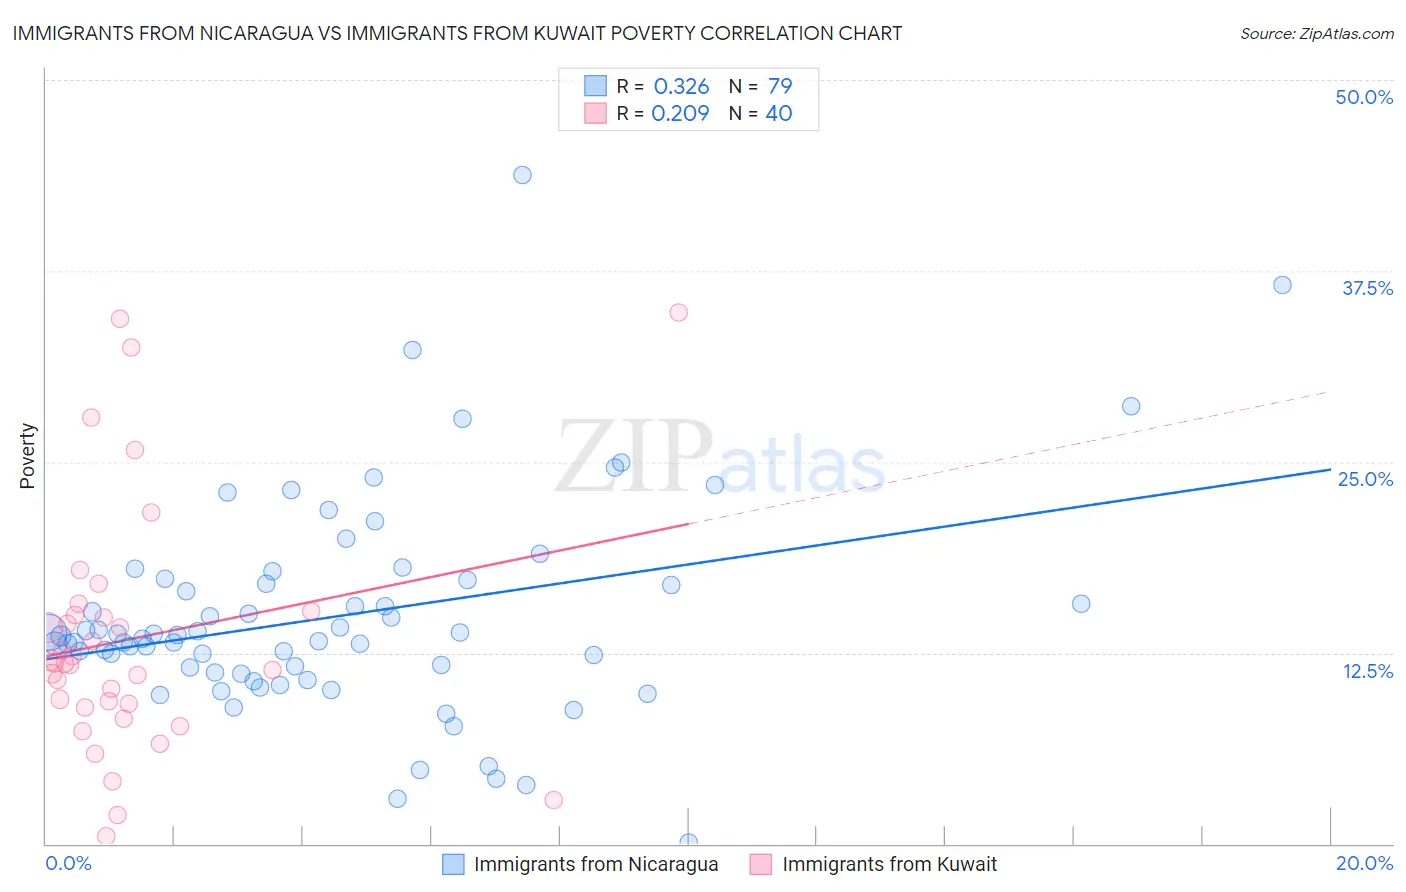
Immigrants from Nicaragua vs Immigrants from Kuwait Poverty Correlation Chart
The statistical analysis conducted on geographies consisting of 236,320,114 people shows a mild positive correlation between the proportion of Immigrants from Nicaragua and poverty level in the United States with a correlation coefficient (R) of 0.326 and weighted average of 14.3%. Similarly, the statistical analysis conducted on geographies consisting of 136,889,651 people shows a weak positive correlation between the proportion of Immigrants from Kuwait and poverty level in the United States with a correlation coefficient (R) of 0.209 and weighted average of 12.7%, a difference of 12.8%.
Poverty Correlation Summary
| Measurement | Immigrants from Nicaragua | Immigrants from Kuwait |
| Minimum | 0.098% | 0.47% |
| Maximum | 43.8% | 34.8% |
| Range | 43.7% | 34.3% |
| Mean | 14.9% | 13.4% |
| Median | 13.6% | 11.8% |
| Interquartile 25% (IQ1) | 11.2% | 9.0% |
| Interquartile 75% (IQ3) | 17.3% | 15.1% |
| Interquartile Range (IQR) | 6.1% | 6.1% |
| Standard Deviation (Sample) | 7.1% | 8.1% |
| Standard Deviation (Population) | 7.0% | 8.0% |
Similar Demographics by Poverty
Demographics Similar to Immigrants from Nicaragua by Poverty
In terms of poverty, the demographic groups most similar to Immigrants from Nicaragua are Cape Verdean (14.4%, a difference of 0.080%), Cherokee (14.4%, a difference of 0.10%), Immigrants from Liberia (14.4%, a difference of 0.26%), Ottawa (14.3%, a difference of 0.27%), and Trinidadian and Tobagonian (14.3%, a difference of 0.28%).
| Demographics | Rating | Rank | Poverty |
| Spanish American Indians | 0.2 /100 | #252 | Tragic 14.2% |
| Immigrants | Trinidad and Tobago | 0.2 /100 | #253 | Tragic 14.2% |
| Immigrants | El Salvador | 0.1 /100 | #254 | Tragic 14.3% |
| Immigrants | Ecuador | 0.1 /100 | #255 | Tragic 14.3% |
| Mexican American Indians | 0.1 /100 | #256 | Tragic 14.3% |
| Trinidadians and Tobagonians | 0.1 /100 | #257 | Tragic 14.3% |
| Ottawa | 0.1 /100 | #258 | Tragic 14.3% |
| Immigrants | Nicaragua | 0.1 /100 | #259 | Tragic 14.3% |
| Cape Verdeans | 0.1 /100 | #260 | Tragic 14.4% |
| Cherokee | 0.1 /100 | #261 | Tragic 14.4% |
| Immigrants | Liberia | 0.1 /100 | #262 | Tragic 14.4% |
| Jamaicans | 0.1 /100 | #263 | Tragic 14.4% |
| Immigrants | Jamaica | 0.1 /100 | #264 | Tragic 14.4% |
| Immigrants | Guyana | 0.1 /100 | #265 | Tragic 14.5% |
| Guyanese | 0.1 /100 | #266 | Tragic 14.5% |
Demographics Similar to Immigrants from Kuwait by Poverty
In terms of poverty, the demographic groups most similar to Immigrants from Kuwait are Iraqi (12.7%, a difference of 0.020%), Arab (12.7%, a difference of 0.030%), Delaware (12.7%, a difference of 0.080%), Immigrants from Lebanon (12.8%, a difference of 0.32%), and South American Indian (12.7%, a difference of 0.33%).
| Demographics | Rating | Rank | Poverty |
| Immigrants | Costa Rica | 33.3 /100 | #188 | Fair 12.5% |
| Aleuts | 33.2 /100 | #189 | Fair 12.5% |
| Immigrants | South America | 32.3 /100 | #190 | Fair 12.5% |
| Sierra Leoneans | 31.5 /100 | #191 | Fair 12.6% |
| South American Indians | 23.3 /100 | #192 | Fair 12.7% |
| Delaware | 21.4 /100 | #193 | Fair 12.7% |
| Arabs | 21.1 /100 | #194 | Fair 12.7% |
| Immigrants | Kuwait | 20.9 /100 | #195 | Fair 12.7% |
| Iraqis | 20.8 /100 | #196 | Fair 12.7% |
| Immigrants | Lebanon | 18.7 /100 | #197 | Poor 12.8% |
| Spanish | 18.7 /100 | #198 | Poor 12.8% |
| Immigrants | Kenya | 17.5 /100 | #199 | Poor 12.8% |
| Spaniards | 16.5 /100 | #200 | Poor 12.8% |
| Immigrants | Uganda | 16.5 /100 | #201 | Poor 12.8% |
| Immigrants | Uruguay | 15.6 /100 | #202 | Poor 12.8% |