Immigrants from Singapore vs Immigrants from Kuwait Poverty
COMPARE
Immigrants from Singapore
Immigrants from Kuwait
Poverty
Poverty Comparison
Immigrants from Singapore
Immigrants from Kuwait
10.9%
POVERTY
99.2/ 100
METRIC RATING
43rd/ 347
METRIC RANK
12.7%
POVERTY
20.9/ 100
METRIC RATING
195th/ 347
METRIC RANK
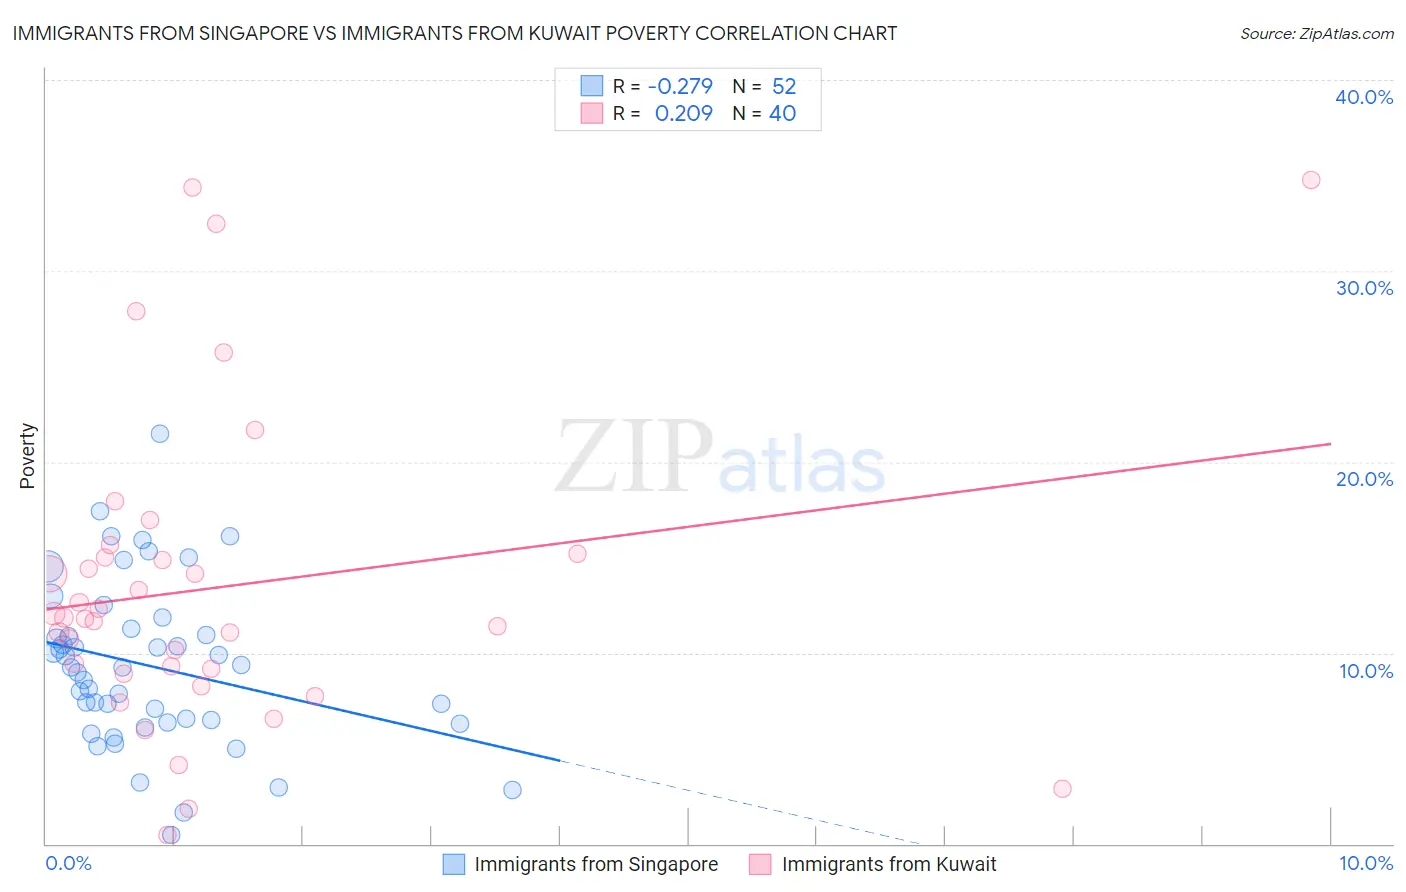
Immigrants from Singapore vs Immigrants from Kuwait Poverty Correlation Chart
The statistical analysis conducted on geographies consisting of 137,414,586 people shows a weak negative correlation between the proportion of Immigrants from Singapore and poverty level in the United States with a correlation coefficient (R) of -0.279 and weighted average of 10.9%. Similarly, the statistical analysis conducted on geographies consisting of 136,889,651 people shows a weak positive correlation between the proportion of Immigrants from Kuwait and poverty level in the United States with a correlation coefficient (R) of 0.209 and weighted average of 12.7%, a difference of 16.7%.
Poverty Correlation Summary
| Measurement | Immigrants from Singapore | Immigrants from Kuwait |
| Minimum | 0.45% | 0.47% |
| Maximum | 21.5% | 34.8% |
| Range | 21.0% | 34.3% |
| Mean | 9.3% | 13.4% |
| Median | 9.2% | 11.8% |
| Interquartile 25% (IQ1) | 6.4% | 9.0% |
| Interquartile 75% (IQ3) | 11.1% | 15.1% |
| Interquartile Range (IQR) | 4.7% | 6.1% |
| Standard Deviation (Sample) | 4.3% | 8.1% |
| Standard Deviation (Population) | 4.2% | 8.0% |
Similar Demographics by Poverty
Demographics Similar to Immigrants from Singapore by Poverty
In terms of poverty, the demographic groups most similar to Immigrants from Singapore are Korean (10.9%, a difference of 0.050%), Immigrants from Moldova (10.9%, a difference of 0.14%), Immigrants from Iran (10.9%, a difference of 0.27%), Russian (10.9%, a difference of 0.36%), and Immigrants from Pakistan (10.8%, a difference of 0.41%).
| Demographics | Rating | Rank | Poverty |
| Cypriots | 99.3 /100 | #36 | Exceptional 10.8% |
| Immigrants | Greece | 99.3 /100 | #37 | Exceptional 10.8% |
| Czechs | 99.3 /100 | #38 | Exceptional 10.8% |
| Immigrants | Pakistan | 99.3 /100 | #39 | Exceptional 10.8% |
| Russians | 99.3 /100 | #40 | Exceptional 10.9% |
| Immigrants | Iran | 99.2 /100 | #41 | Exceptional 10.9% |
| Koreans | 99.2 /100 | #42 | Exceptional 10.9% |
| Immigrants | Singapore | 99.2 /100 | #43 | Exceptional 10.9% |
| Immigrants | Moldova | 99.1 /100 | #44 | Exceptional 10.9% |
| Turks | 98.9 /100 | #45 | Exceptional 11.0% |
| Immigrants | Czechoslovakia | 98.9 /100 | #46 | Exceptional 11.0% |
| Immigrants | Romania | 98.9 /100 | #47 | Exceptional 11.0% |
| Slovenes | 98.9 /100 | #48 | Exceptional 11.0% |
| Immigrants | Japan | 98.9 /100 | #49 | Exceptional 11.0% |
| Asians | 98.9 /100 | #50 | Exceptional 11.0% |
Demographics Similar to Immigrants from Kuwait by Poverty
In terms of poverty, the demographic groups most similar to Immigrants from Kuwait are Iraqi (12.7%, a difference of 0.020%), Arab (12.7%, a difference of 0.030%), Delaware (12.7%, a difference of 0.080%), Immigrants from Lebanon (12.8%, a difference of 0.32%), and South American Indian (12.7%, a difference of 0.33%).
| Demographics | Rating | Rank | Poverty |
| Immigrants | Costa Rica | 33.3 /100 | #188 | Fair 12.5% |
| Aleuts | 33.2 /100 | #189 | Fair 12.5% |
| Immigrants | South America | 32.3 /100 | #190 | Fair 12.5% |
| Sierra Leoneans | 31.5 /100 | #191 | Fair 12.6% |
| South American Indians | 23.3 /100 | #192 | Fair 12.7% |
| Delaware | 21.4 /100 | #193 | Fair 12.7% |
| Arabs | 21.1 /100 | #194 | Fair 12.7% |
| Immigrants | Kuwait | 20.9 /100 | #195 | Fair 12.7% |
| Iraqis | 20.8 /100 | #196 | Fair 12.7% |
| Immigrants | Lebanon | 18.7 /100 | #197 | Poor 12.8% |
| Spanish | 18.7 /100 | #198 | Poor 12.8% |
| Immigrants | Kenya | 17.5 /100 | #199 | Poor 12.8% |
| Spaniards | 16.5 /100 | #200 | Poor 12.8% |
| Immigrants | Uganda | 16.5 /100 | #201 | Poor 12.8% |
| Immigrants | Uruguay | 15.6 /100 | #202 | Poor 12.8% |