English vs Immigrants from Kazakhstan Married-Couple Family Poverty
COMPARE
English
Immigrants from Kazakhstan
Married-Couple Family Poverty
Married-Couple Family Poverty Comparison
English
Immigrants from Kazakhstan
4.2%
MARRIED-COUPLE FAMILY POVERTY
99.9/ 100
METRIC RATING
36th/ 347
METRIC RANK
5.2%
MARRIED-COUPLE FAMILY POVERTY
45.1/ 100
METRIC RATING
177th/ 347
METRIC RANK
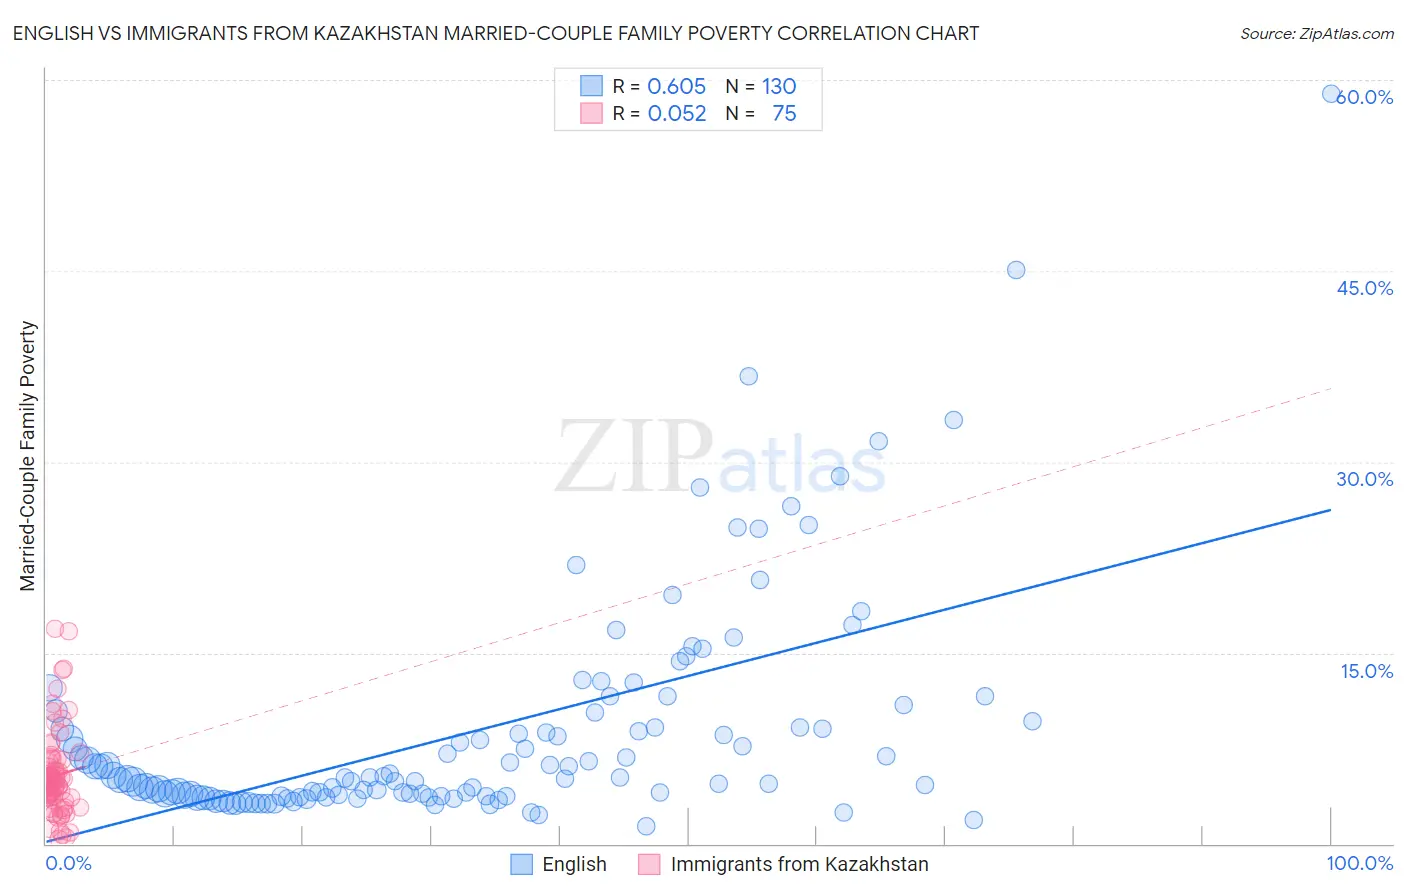
English vs Immigrants from Kazakhstan Married-Couple Family Poverty Correlation Chart
The statistical analysis conducted on geographies consisting of 562,851,245 people shows a significant positive correlation between the proportion of English and poverty level among married-couple families in the United States with a correlation coefficient (R) of 0.605 and weighted average of 4.2%. Similarly, the statistical analysis conducted on geographies consisting of 124,106,398 people shows a slight positive correlation between the proportion of Immigrants from Kazakhstan and poverty level among married-couple families in the United States with a correlation coefficient (R) of 0.052 and weighted average of 5.2%, a difference of 24.3%.
Married-Couple Family Poverty Correlation Summary
| Measurement | English | Immigrants from Kazakhstan |
| Minimum | 1.4% | 0.43% |
| Maximum | 58.9% | 16.9% |
| Range | 57.6% | 16.5% |
| Mean | 8.9% | 5.4% |
| Median | 5.2% | 4.7% |
| Interquartile 25% (IQ1) | 3.7% | 3.4% |
| Interquartile 75% (IQ3) | 9.6% | 6.6% |
| Interquartile Range (IQR) | 5.9% | 3.2% |
| Standard Deviation (Sample) | 9.0% | 3.4% |
| Standard Deviation (Population) | 8.9% | 3.4% |
Similar Demographics by Married-Couple Family Poverty
Demographics Similar to English by Married-Couple Family Poverty
In terms of married-couple family poverty, the demographic groups most similar to English are European (4.2%, a difference of 0.030%), Iranian (4.2%, a difference of 0.070%), Belgian (4.2%, a difference of 0.19%), Immigrants from Northern Europe (4.2%, a difference of 0.32%), and Dutch (4.2%, a difference of 0.60%).
| Demographics | Rating | Rank | Married-Couple Family Poverty |
| Immigrants | Scotland | 99.9 /100 | #29 | Exceptional 4.2% |
| Finns | 99.9 /100 | #30 | Exceptional 4.2% |
| Estonians | 99.9 /100 | #31 | Exceptional 4.2% |
| Greeks | 99.9 /100 | #32 | Exceptional 4.2% |
| Irish | 99.9 /100 | #33 | Exceptional 4.2% |
| Dutch | 99.9 /100 | #34 | Exceptional 4.2% |
| Europeans | 99.9 /100 | #35 | Exceptional 4.2% |
| English | 99.9 /100 | #36 | Exceptional 4.2% |
| Iranians | 99.9 /100 | #37 | Exceptional 4.2% |
| Belgians | 99.9 /100 | #38 | Exceptional 4.2% |
| Immigrants | Northern Europe | 99.8 /100 | #39 | Exceptional 4.2% |
| French Canadians | 99.8 /100 | #40 | Exceptional 4.2% |
| Northern Europeans | 99.8 /100 | #41 | Exceptional 4.3% |
| Scottish | 99.8 /100 | #42 | Exceptional 4.3% |
| Swiss | 99.8 /100 | #43 | Exceptional 4.3% |
Demographics Similar to Immigrants from Kazakhstan by Married-Couple Family Poverty
In terms of married-couple family poverty, the demographic groups most similar to Immigrants from Kazakhstan are Immigrants from Ukraine (5.2%, a difference of 0.020%), Menominee (5.2%, a difference of 0.32%), Marshallese (5.2%, a difference of 0.33%), Spanish (5.3%, a difference of 0.44%), and Immigrants from Eastern Africa (5.2%, a difference of 0.57%).
| Demographics | Rating | Rank | Married-Couple Family Poverty |
| Immigrants | Argentina | 54.4 /100 | #170 | Average 5.2% |
| Bermudans | 52.9 /100 | #171 | Average 5.2% |
| Immigrants | Northern Africa | 51.3 /100 | #172 | Average 5.2% |
| Alsatians | 51.2 /100 | #173 | Average 5.2% |
| Immigrants | Eastern Africa | 50.0 /100 | #174 | Average 5.2% |
| Marshallese | 47.9 /100 | #175 | Average 5.2% |
| Menominee | 47.8 /100 | #176 | Average 5.2% |
| Immigrants | Kazakhstan | 45.1 /100 | #177 | Average 5.2% |
| Immigrants | Ukraine | 44.9 /100 | #178 | Average 5.2% |
| Spanish | 41.4 /100 | #179 | Average 5.3% |
| Immigrants | Sierra Leone | 39.3 /100 | #180 | Fair 5.3% |
| Immigrants | Chile | 38.8 /100 | #181 | Fair 5.3% |
| Immigrants | Vietnam | 37.7 /100 | #182 | Fair 5.3% |
| Peruvians | 37.6 /100 | #183 | Fair 5.3% |
| Immigrants | Nonimmigrants | 35.8 /100 | #184 | Fair 5.3% |