English vs Malaysian Married-Couple Family Poverty
COMPARE
English
Malaysian
Married-Couple Family Poverty
Married-Couple Family Poverty Comparison
English
Malaysians
4.2%
MARRIED-COUPLE FAMILY POVERTY
99.9/ 100
METRIC RATING
36th/ 347
METRIC RANK
5.4%
MARRIED-COUPLE FAMILY POVERTY
29.5/ 100
METRIC RATING
193rd/ 347
METRIC RANK
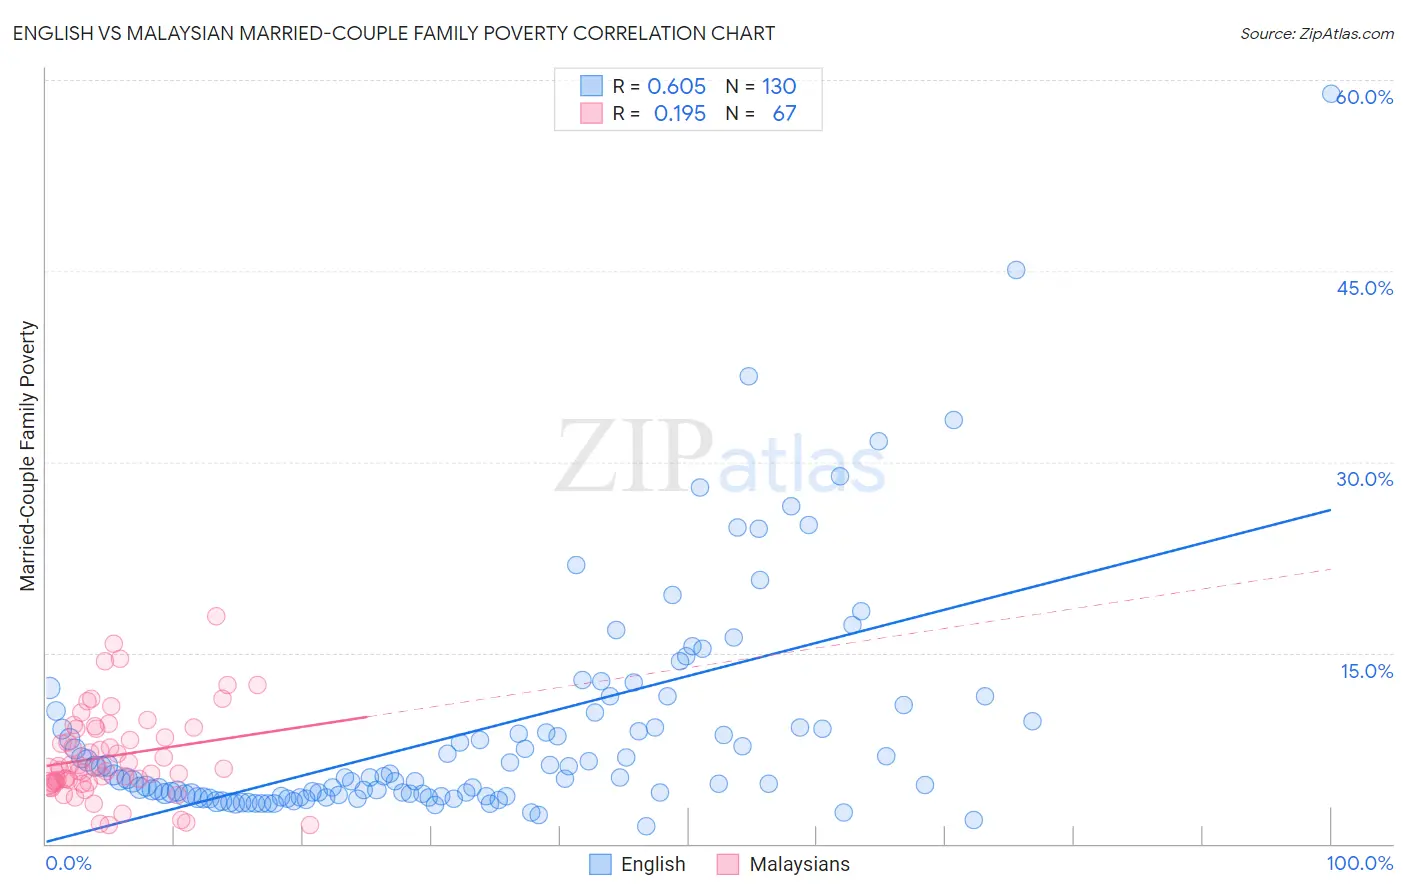
English vs Malaysian Married-Couple Family Poverty Correlation Chart
The statistical analysis conducted on geographies consisting of 562,851,245 people shows a significant positive correlation between the proportion of English and poverty level among married-couple families in the United States with a correlation coefficient (R) of 0.605 and weighted average of 4.2%. Similarly, the statistical analysis conducted on geographies consisting of 224,983,530 people shows a poor positive correlation between the proportion of Malaysians and poverty level among married-couple families in the United States with a correlation coefficient (R) of 0.195 and weighted average of 5.4%, a difference of 26.7%.
Married-Couple Family Poverty Correlation Summary
| Measurement | English | Malaysian |
| Minimum | 1.4% | 1.5% |
| Maximum | 58.9% | 17.9% |
| Range | 57.6% | 16.4% |
| Mean | 8.9% | 6.9% |
| Median | 5.2% | 5.9% |
| Interquartile 25% (IQ1) | 3.7% | 4.8% |
| Interquartile 75% (IQ3) | 9.6% | 9.1% |
| Interquartile Range (IQR) | 5.9% | 4.2% |
| Standard Deviation (Sample) | 9.0% | 3.5% |
| Standard Deviation (Population) | 8.9% | 3.4% |
Similar Demographics by Married-Couple Family Poverty
Demographics Similar to English by Married-Couple Family Poverty
In terms of married-couple family poverty, the demographic groups most similar to English are European (4.2%, a difference of 0.030%), Iranian (4.2%, a difference of 0.070%), Belgian (4.2%, a difference of 0.19%), Immigrants from Northern Europe (4.2%, a difference of 0.32%), and Dutch (4.2%, a difference of 0.60%).
| Demographics | Rating | Rank | Married-Couple Family Poverty |
| Immigrants | Scotland | 99.9 /100 | #29 | Exceptional 4.2% |
| Finns | 99.9 /100 | #30 | Exceptional 4.2% |
| Estonians | 99.9 /100 | #31 | Exceptional 4.2% |
| Greeks | 99.9 /100 | #32 | Exceptional 4.2% |
| Irish | 99.9 /100 | #33 | Exceptional 4.2% |
| Dutch | 99.9 /100 | #34 | Exceptional 4.2% |
| Europeans | 99.9 /100 | #35 | Exceptional 4.2% |
| English | 99.9 /100 | #36 | Exceptional 4.2% |
| Iranians | 99.9 /100 | #37 | Exceptional 4.2% |
| Belgians | 99.9 /100 | #38 | Exceptional 4.2% |
| Immigrants | Northern Europe | 99.8 /100 | #39 | Exceptional 4.2% |
| French Canadians | 99.8 /100 | #40 | Exceptional 4.2% |
| Northern Europeans | 99.8 /100 | #41 | Exceptional 4.3% |
| Scottish | 99.8 /100 | #42 | Exceptional 4.3% |
| Swiss | 99.8 /100 | #43 | Exceptional 4.3% |
Demographics Similar to Malaysians by Married-Couple Family Poverty
In terms of married-couple family poverty, the demographic groups most similar to Malaysians are Cape Verdean (5.3%, a difference of 0.17%), Immigrants from Cabo Verde (5.3%, a difference of 0.19%), Immigrants from Israel (5.4%, a difference of 0.22%), Immigrants from the Azores (5.4%, a difference of 0.27%), and Ugandan (5.3%, a difference of 0.29%).
| Demographics | Rating | Rank | Married-Couple Family Poverty |
| Hungarians | 34.7 /100 | #186 | Fair 5.3% |
| Immigrants | Albania | 33.8 /100 | #187 | Fair 5.3% |
| Israelis | 33.1 /100 | #188 | Fair 5.3% |
| South American Indians | 32.5 /100 | #189 | Fair 5.3% |
| Ugandans | 31.6 /100 | #190 | Fair 5.3% |
| Immigrants | Cabo Verde | 30.9 /100 | #191 | Fair 5.3% |
| Cape Verdeans | 30.7 /100 | #192 | Fair 5.3% |
| Malaysians | 29.5 /100 | #193 | Fair 5.4% |
| Immigrants | Israel | 27.8 /100 | #194 | Fair 5.4% |
| Immigrants | Azores | 27.5 /100 | #195 | Fair 5.4% |
| Spaniards | 27.4 /100 | #196 | Fair 5.4% |
| Liberians | 26.3 /100 | #197 | Fair 5.4% |
| Immigrants | Belarus | 26.2 /100 | #198 | Fair 5.4% |
| Uruguayans | 25.0 /100 | #199 | Fair 5.4% |
| Immigrants | Morocco | 24.3 /100 | #200 | Fair 5.4% |