Czechoslovakian vs Immigrants from Germany Female Poverty
COMPARE
Czechoslovakian
Immigrants from Germany
Female Poverty
Female Poverty Comparison
Czechoslovakians
Immigrants from Germany
12.4%
FEMALE POVERTY
95.7/ 100
METRIC RATING
92nd/ 347
METRIC RANK
13.1%
FEMALE POVERTY
74.9/ 100
METRIC RATING
151st/ 347
METRIC RANK
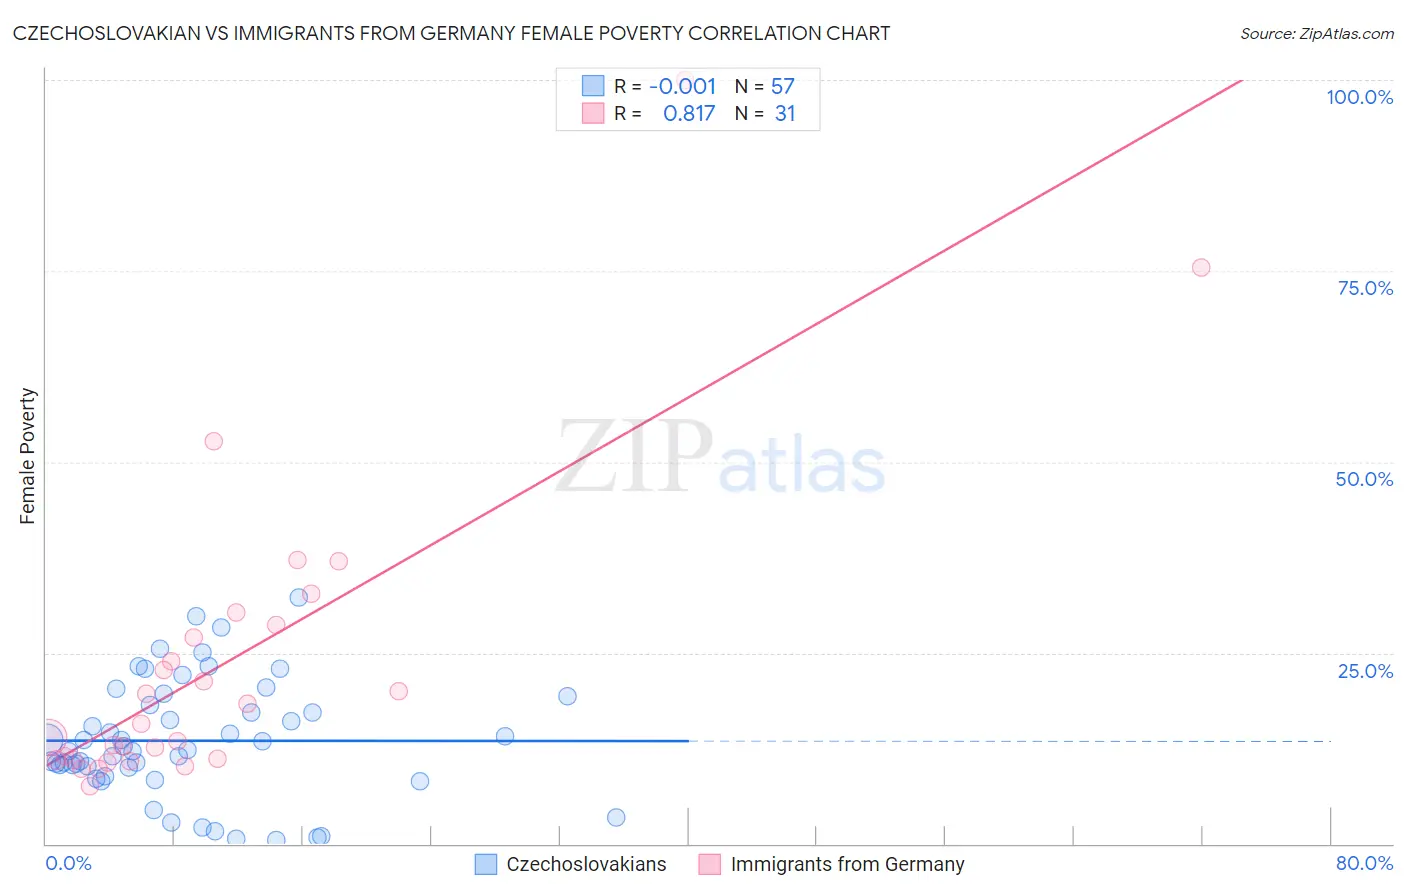
Czechoslovakian vs Immigrants from Germany Female Poverty Correlation Chart
The statistical analysis conducted on geographies consisting of 368,467,863 people shows no correlation between the proportion of Czechoslovakians and poverty level among females in the United States with a correlation coefficient (R) of -0.001 and weighted average of 12.4%. Similarly, the statistical analysis conducted on geographies consisting of 463,610,140 people shows a very strong positive correlation between the proportion of Immigrants from Germany and poverty level among females in the United States with a correlation coefficient (R) of 0.817 and weighted average of 13.1%, a difference of 5.3%.
Female Poverty Correlation Summary
| Measurement | Czechoslovakian | Immigrants from Germany |
| Minimum | 0.52% | 7.5% |
| Maximum | 32.3% | 100.0% |
| Range | 31.8% | 92.5% |
| Mean | 13.5% | 23.6% |
| Median | 12.3% | 15.7% |
| Interquartile 25% (IQ1) | 9.4% | 10.9% |
| Interquartile 75% (IQ3) | 18.7% | 28.6% |
| Interquartile Range (IQR) | 9.3% | 17.6% |
| Standard Deviation (Sample) | 7.6% | 20.3% |
| Standard Deviation (Population) | 7.5% | 20.0% |
Similar Demographics by Female Poverty
Demographics Similar to Czechoslovakians by Female Poverty
In terms of female poverty, the demographic groups most similar to Czechoslovakians are Belgian (12.4%, a difference of 0.010%), Immigrants from Denmark (12.4%, a difference of 0.020%), Immigrants from Egypt (12.5%, a difference of 0.17%), Immigrants from Indonesia (12.5%, a difference of 0.20%), and English (12.4%, a difference of 0.24%).
| Demographics | Rating | Rank | Female Poverty |
| Irish | 96.5 /100 | #85 | Exceptional 12.4% |
| Dutch | 96.5 /100 | #86 | Exceptional 12.4% |
| Okinawans | 96.4 /100 | #87 | Exceptional 12.4% |
| Finns | 96.4 /100 | #88 | Exceptional 12.4% |
| English | 96.1 /100 | #89 | Exceptional 12.4% |
| Immigrants | Denmark | 95.8 /100 | #90 | Exceptional 12.4% |
| Belgians | 95.8 /100 | #91 | Exceptional 12.4% |
| Czechoslovakians | 95.7 /100 | #92 | Exceptional 12.4% |
| Immigrants | Egypt | 95.5 /100 | #93 | Exceptional 12.5% |
| Immigrants | Indonesia | 95.4 /100 | #94 | Exceptional 12.5% |
| Immigrants | South Africa | 95.4 /100 | #95 | Exceptional 12.5% |
| British | 95.2 /100 | #96 | Exceptional 12.5% |
| Australians | 95.2 /100 | #97 | Exceptional 12.5% |
| Native Hawaiians | 95.1 /100 | #98 | Exceptional 12.5% |
| Romanians | 95.1 /100 | #99 | Exceptional 12.5% |
Demographics Similar to Immigrants from Germany by Female Poverty
In terms of female poverty, the demographic groups most similar to Immigrants from Germany are Tsimshian (13.1%, a difference of 0.070%), Taiwanese (13.1%, a difference of 0.10%), Samoan (13.1%, a difference of 0.17%), Yugoslavian (13.1%, a difference of 0.26%), and Immigrants from Fiji (13.2%, a difference of 0.49%).
| Demographics | Rating | Rank | Female Poverty |
| Afghans | 79.8 /100 | #144 | Good 13.0% |
| Syrians | 79.6 /100 | #145 | Good 13.0% |
| Immigrants | Peru | 79.1 /100 | #146 | Good 13.0% |
| Immigrants | Kazakhstan | 78.6 /100 | #147 | Good 13.0% |
| Yugoslavians | 76.9 /100 | #148 | Good 13.1% |
| Taiwanese | 75.7 /100 | #149 | Good 13.1% |
| Tsimshian | 75.5 /100 | #150 | Good 13.1% |
| Immigrants | Germany | 74.9 /100 | #151 | Good 13.1% |
| Samoans | 73.6 /100 | #152 | Good 13.1% |
| Immigrants | Fiji | 71.0 /100 | #153 | Good 13.2% |
| Armenians | 70.4 /100 | #154 | Good 13.2% |
| Hungarians | 70.1 /100 | #155 | Good 13.2% |
| Immigrants | Bosnia and Herzegovina | 69.7 /100 | #156 | Good 13.2% |
| Immigrants | Northern Africa | 68.8 /100 | #157 | Good 13.2% |
| Pennsylvania Germans | 67.3 /100 | #158 | Good 13.2% |