Czechoslovakian vs Sri Lankan Female Poverty
COMPARE
Czechoslovakian
Sri Lankan
Female Poverty
Female Poverty Comparison
Czechoslovakians
Sri Lankans
12.4%
FEMALE POVERTY
95.7/ 100
METRIC RATING
92nd/ 347
METRIC RANK
12.7%
FEMALE POVERTY
90.9/ 100
METRIC RATING
118th/ 347
METRIC RANK
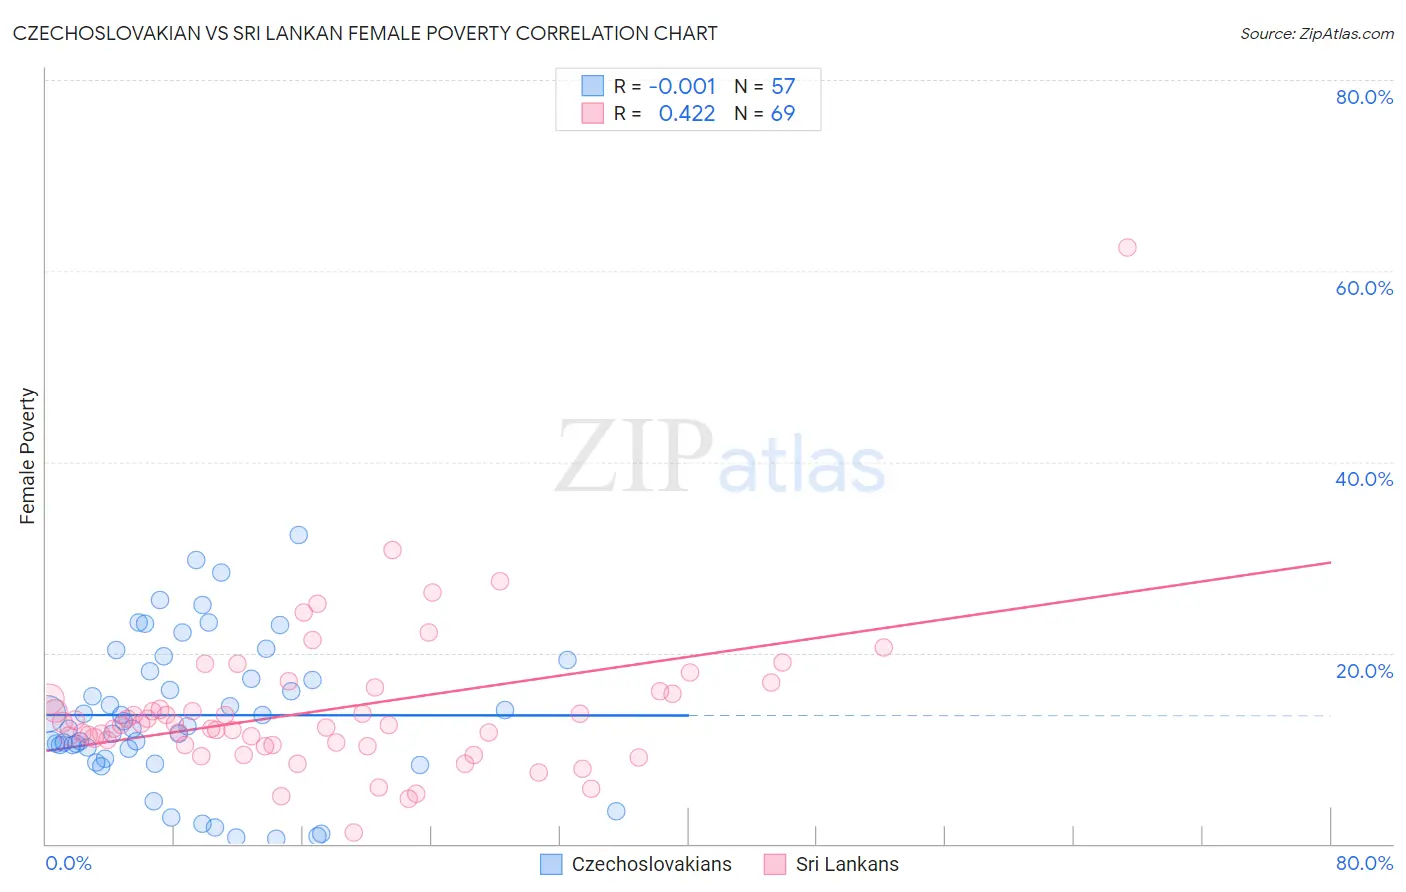
Czechoslovakian vs Sri Lankan Female Poverty Correlation Chart
The statistical analysis conducted on geographies consisting of 368,467,863 people shows no correlation between the proportion of Czechoslovakians and poverty level among females in the United States with a correlation coefficient (R) of -0.001 and weighted average of 12.4%. Similarly, the statistical analysis conducted on geographies consisting of 440,042,655 people shows a moderate positive correlation between the proportion of Sri Lankans and poverty level among females in the United States with a correlation coefficient (R) of 0.422 and weighted average of 12.7%, a difference of 2.1%.
Female Poverty Correlation Summary
| Measurement | Czechoslovakian | Sri Lankan |
| Minimum | 0.52% | 1.2% |
| Maximum | 32.3% | 62.5% |
| Range | 31.8% | 61.3% |
| Mean | 13.5% | 14.0% |
| Median | 12.3% | 12.5% |
| Interquartile 25% (IQ1) | 9.4% | 10.3% |
| Interquartile 75% (IQ3) | 18.7% | 15.8% |
| Interquartile Range (IQR) | 9.3% | 5.5% |
| Standard Deviation (Sample) | 7.6% | 8.1% |
| Standard Deviation (Population) | 7.5% | 8.0% |
Similar Demographics by Female Poverty
Demographics Similar to Czechoslovakians by Female Poverty
In terms of female poverty, the demographic groups most similar to Czechoslovakians are Belgian (12.4%, a difference of 0.010%), Immigrants from Denmark (12.4%, a difference of 0.020%), Immigrants from Egypt (12.5%, a difference of 0.17%), Immigrants from Indonesia (12.5%, a difference of 0.20%), and English (12.4%, a difference of 0.24%).
| Demographics | Rating | Rank | Female Poverty |
| Irish | 96.5 /100 | #85 | Exceptional 12.4% |
| Dutch | 96.5 /100 | #86 | Exceptional 12.4% |
| Okinawans | 96.4 /100 | #87 | Exceptional 12.4% |
| Finns | 96.4 /100 | #88 | Exceptional 12.4% |
| English | 96.1 /100 | #89 | Exceptional 12.4% |
| Immigrants | Denmark | 95.8 /100 | #90 | Exceptional 12.4% |
| Belgians | 95.8 /100 | #91 | Exceptional 12.4% |
| Czechoslovakians | 95.7 /100 | #92 | Exceptional 12.4% |
| Immigrants | Egypt | 95.5 /100 | #93 | Exceptional 12.5% |
| Immigrants | Indonesia | 95.4 /100 | #94 | Exceptional 12.5% |
| Immigrants | South Africa | 95.4 /100 | #95 | Exceptional 12.5% |
| British | 95.2 /100 | #96 | Exceptional 12.5% |
| Australians | 95.2 /100 | #97 | Exceptional 12.5% |
| Native Hawaiians | 95.1 /100 | #98 | Exceptional 12.5% |
| Romanians | 95.1 /100 | #99 | Exceptional 12.5% |
Demographics Similar to Sri Lankans by Female Poverty
In terms of female poverty, the demographic groups most similar to Sri Lankans are Albanian (12.7%, a difference of 0.010%), Immigrants from Southern Europe (12.7%, a difference of 0.020%), New Zealander (12.7%, a difference of 0.070%), Immigrants from Russia (12.7%, a difference of 0.090%), and Immigrants from Hungary (12.7%, a difference of 0.17%).
| Demographics | Rating | Rank | Female Poverty |
| Soviet Union | 92.4 /100 | #111 | Exceptional 12.6% |
| Immigrants | Israel | 92.0 /100 | #112 | Exceptional 12.6% |
| Canadians | 92.0 /100 | #113 | Exceptional 12.7% |
| Welsh | 91.6 /100 | #114 | Exceptional 12.7% |
| Puget Sound Salish | 91.5 /100 | #115 | Exceptional 12.7% |
| Immigrants | Russia | 91.2 /100 | #116 | Exceptional 12.7% |
| Immigrants | Southern Europe | 90.9 /100 | #117 | Exceptional 12.7% |
| Sri Lankans | 90.9 /100 | #118 | Exceptional 12.7% |
| Albanians | 90.8 /100 | #119 | Exceptional 12.7% |
| New Zealanders | 90.6 /100 | #120 | Exceptional 12.7% |
| Immigrants | Hungary | 90.3 /100 | #121 | Exceptional 12.7% |
| French Canadians | 90.2 /100 | #122 | Exceptional 12.7% |
| Immigrants | South Eastern Asia | 89.9 /100 | #123 | Excellent 12.7% |
| Immigrants | Norway | 89.3 /100 | #124 | Excellent 12.8% |
| Argentineans | 89.1 /100 | #125 | Excellent 12.8% |