German Russian vs Immigrants from Germany Female Poverty
COMPARE
German Russian
Immigrants from Germany
Female Poverty
Female Poverty Comparison
German Russians
Immigrants from Germany
14.7%
FEMALE POVERTY
2.0/ 100
METRIC RATING
228th/ 347
METRIC RANK
13.1%
FEMALE POVERTY
74.9/ 100
METRIC RATING
151st/ 347
METRIC RANK
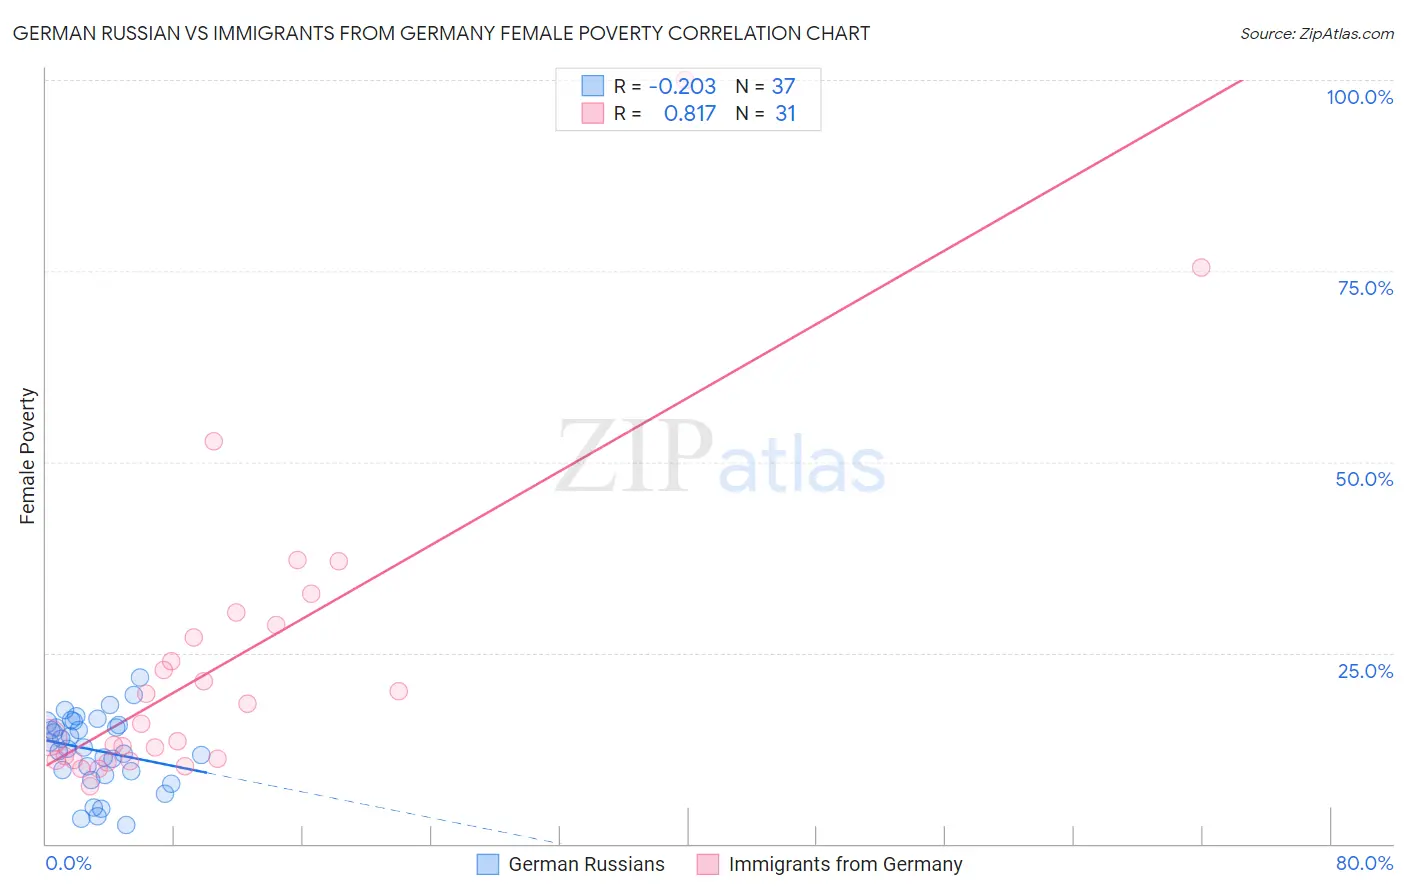
German Russian vs Immigrants from Germany Female Poverty Correlation Chart
The statistical analysis conducted on geographies consisting of 96,439,432 people shows a weak negative correlation between the proportion of German Russians and poverty level among females in the United States with a correlation coefficient (R) of -0.203 and weighted average of 14.7%. Similarly, the statistical analysis conducted on geographies consisting of 463,610,140 people shows a very strong positive correlation between the proportion of Immigrants from Germany and poverty level among females in the United States with a correlation coefficient (R) of 0.817 and weighted average of 13.1%, a difference of 12.3%.
Female Poverty Correlation Summary
| Measurement | German Russian | Immigrants from Germany |
| Minimum | 2.5% | 7.5% |
| Maximum | 21.7% | 100.0% |
| Range | 19.2% | 92.5% |
| Mean | 12.2% | 23.6% |
| Median | 12.6% | 15.7% |
| Interquartile 25% (IQ1) | 9.2% | 10.9% |
| Interquartile 75% (IQ3) | 15.8% | 28.6% |
| Interquartile Range (IQR) | 6.6% | 17.6% |
| Standard Deviation (Sample) | 4.7% | 20.3% |
| Standard Deviation (Population) | 4.7% | 20.0% |
Similar Demographics by Female Poverty
Demographics Similar to German Russians by Female Poverty
In terms of female poverty, the demographic groups most similar to German Russians are Ghanaian (14.7%, a difference of 0.060%), Immigrants from Nigeria (14.7%, a difference of 0.15%), Alaska Native (14.7%, a difference of 0.27%), Nigerian (14.8%, a difference of 0.36%), and Immigrants from Eritrea (14.6%, a difference of 0.45%).
| Demographics | Rating | Rank | Female Poverty |
| Immigrants | Cambodia | 3.7 /100 | #221 | Tragic 14.5% |
| Immigrants | Nonimmigrants | 3.7 /100 | #222 | Tragic 14.5% |
| Immigrants | Africa | 3.3 /100 | #223 | Tragic 14.5% |
| Americans | 2.8 /100 | #224 | Tragic 14.6% |
| Immigrants | Micronesia | 2.8 /100 | #225 | Tragic 14.6% |
| Immigrants | Eritrea | 2.4 /100 | #226 | Tragic 14.6% |
| Immigrants | Nigeria | 2.1 /100 | #227 | Tragic 14.7% |
| German Russians | 2.0 /100 | #228 | Tragic 14.7% |
| Ghanaians | 1.9 /100 | #229 | Tragic 14.7% |
| Alaska Natives | 1.8 /100 | #230 | Tragic 14.7% |
| Nigerians | 1.7 /100 | #231 | Tragic 14.8% |
| Osage | 1.5 /100 | #232 | Tragic 14.8% |
| Immigrants | Saudi Arabia | 1.4 /100 | #233 | Tragic 14.8% |
| Fijians | 1.1 /100 | #234 | Tragic 14.9% |
| Immigrants | Laos | 0.9 /100 | #235 | Tragic 15.0% |
Demographics Similar to Immigrants from Germany by Female Poverty
In terms of female poverty, the demographic groups most similar to Immigrants from Germany are Tsimshian (13.1%, a difference of 0.070%), Taiwanese (13.1%, a difference of 0.10%), Samoan (13.1%, a difference of 0.17%), Yugoslavian (13.1%, a difference of 0.26%), and Immigrants from Fiji (13.2%, a difference of 0.49%).
| Demographics | Rating | Rank | Female Poverty |
| Afghans | 79.8 /100 | #144 | Good 13.0% |
| Syrians | 79.6 /100 | #145 | Good 13.0% |
| Immigrants | Peru | 79.1 /100 | #146 | Good 13.0% |
| Immigrants | Kazakhstan | 78.6 /100 | #147 | Good 13.0% |
| Yugoslavians | 76.9 /100 | #148 | Good 13.1% |
| Taiwanese | 75.7 /100 | #149 | Good 13.1% |
| Tsimshian | 75.5 /100 | #150 | Good 13.1% |
| Immigrants | Germany | 74.9 /100 | #151 | Good 13.1% |
| Samoans | 73.6 /100 | #152 | Good 13.1% |
| Immigrants | Fiji | 71.0 /100 | #153 | Good 13.2% |
| Armenians | 70.4 /100 | #154 | Good 13.2% |
| Hungarians | 70.1 /100 | #155 | Good 13.2% |
| Immigrants | Bosnia and Herzegovina | 69.7 /100 | #156 | Good 13.2% |
| Immigrants | Northern Africa | 68.8 /100 | #157 | Good 13.2% |
| Pennsylvania Germans | 67.3 /100 | #158 | Good 13.2% |