Czechoslovakian vs Zimbabwean Female Poverty
COMPARE
Czechoslovakian
Zimbabwean
Female Poverty
Female Poverty Comparison
Czechoslovakians
Zimbabweans
12.4%
FEMALE POVERTY
95.7/ 100
METRIC RATING
92nd/ 347
METRIC RANK
12.3%
FEMALE POVERTY
97.5/ 100
METRIC RATING
73rd/ 347
METRIC RANK
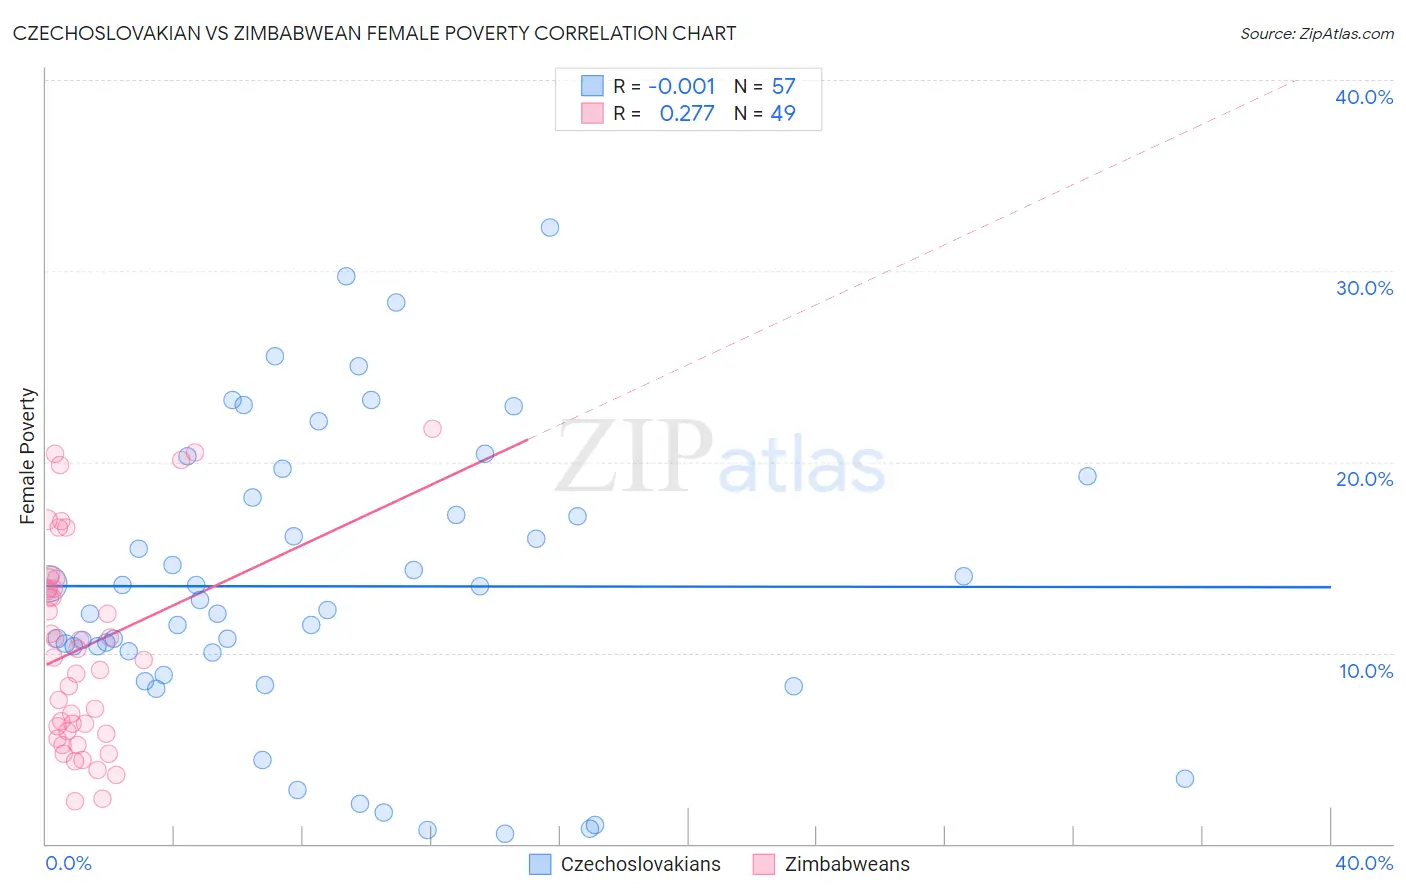
Czechoslovakian vs Zimbabwean Female Poverty Correlation Chart
The statistical analysis conducted on geographies consisting of 368,467,863 people shows no correlation between the proportion of Czechoslovakians and poverty level among females in the United States with a correlation coefficient (R) of -0.001 and weighted average of 12.4%. Similarly, the statistical analysis conducted on geographies consisting of 69,185,827 people shows a weak positive correlation between the proportion of Zimbabweans and poverty level among females in the United States with a correlation coefficient (R) of 0.277 and weighted average of 12.3%, a difference of 1.5%.
Female Poverty Correlation Summary
| Measurement | Czechoslovakian | Zimbabwean |
| Minimum | 0.52% | 2.2% |
| Maximum | 32.3% | 21.7% |
| Range | 31.8% | 19.5% |
| Mean | 13.5% | 10.3% |
| Median | 12.3% | 9.7% |
| Interquartile 25% (IQ1) | 9.4% | 5.8% |
| Interquartile 75% (IQ3) | 18.7% | 13.6% |
| Interquartile Range (IQR) | 9.3% | 7.8% |
| Standard Deviation (Sample) | 7.6% | 5.3% |
| Standard Deviation (Population) | 7.5% | 5.2% |
Demographics Similar to Czechoslovakians and Zimbabweans by Female Poverty
In terms of female poverty, the demographic groups most similar to Czechoslovakians are Belgian (12.4%, a difference of 0.010%), Immigrants from Denmark (12.4%, a difference of 0.020%), English (12.4%, a difference of 0.24%), Finnish (12.4%, a difference of 0.44%), and Okinawan (12.4%, a difference of 0.49%). Similarly, the demographic groups most similar to Zimbabweans are Immigrants from Canada (12.3%, a difference of 0.010%), Cambodian (12.2%, a difference of 0.020%), European (12.3%, a difference of 0.13%), Immigrants from Eastern Europe (12.3%, a difference of 0.30%), and Serbian (12.3%, a difference of 0.33%).
| Demographics | Rating | Rank | Female Poverty |
| Cambodians | 97.5 /100 | #72 | Exceptional 12.2% |
| Zimbabweans | 97.5 /100 | #73 | Exceptional 12.3% |
| Immigrants | Canada | 97.5 /100 | #74 | Exceptional 12.3% |
| Europeans | 97.4 /100 | #75 | Exceptional 12.3% |
| Immigrants | Eastern Europe | 97.2 /100 | #76 | Exceptional 12.3% |
| Serbians | 97.2 /100 | #77 | Exceptional 12.3% |
| Egyptians | 97.2 /100 | #78 | Exceptional 12.3% |
| Immigrants | North America | 97.1 /100 | #79 | Exceptional 12.3% |
| Slovaks | 97.1 /100 | #80 | Exceptional 12.3% |
| Immigrants | Sweden | 97.1 /100 | #81 | Exceptional 12.3% |
| Jordanians | 97.1 /100 | #82 | Exceptional 12.3% |
| Immigrants | England | 96.9 /100 | #83 | Exceptional 12.3% |
| Northern Europeans | 96.6 /100 | #84 | Exceptional 12.4% |
| Irish | 96.5 /100 | #85 | Exceptional 12.4% |
| Dutch | 96.5 /100 | #86 | Exceptional 12.4% |
| Okinawans | 96.4 /100 | #87 | Exceptional 12.4% |
| Finns | 96.4 /100 | #88 | Exceptional 12.4% |
| English | 96.1 /100 | #89 | Exceptional 12.4% |
| Immigrants | Denmark | 95.8 /100 | #90 | Exceptional 12.4% |
| Belgians | 95.8 /100 | #91 | Exceptional 12.4% |
| Czechoslovakians | 95.7 /100 | #92 | Exceptional 12.4% |