Vietnamese vs Immigrants from Germany Female Poverty
COMPARE
Vietnamese
Immigrants from Germany
Female Poverty
Female Poverty Comparison
Vietnamese
Immigrants from Germany
16.1%
FEMALE POVERTY
0.0/ 100
METRIC RATING
280th/ 347
METRIC RANK
13.1%
FEMALE POVERTY
74.9/ 100
METRIC RATING
151st/ 347
METRIC RANK
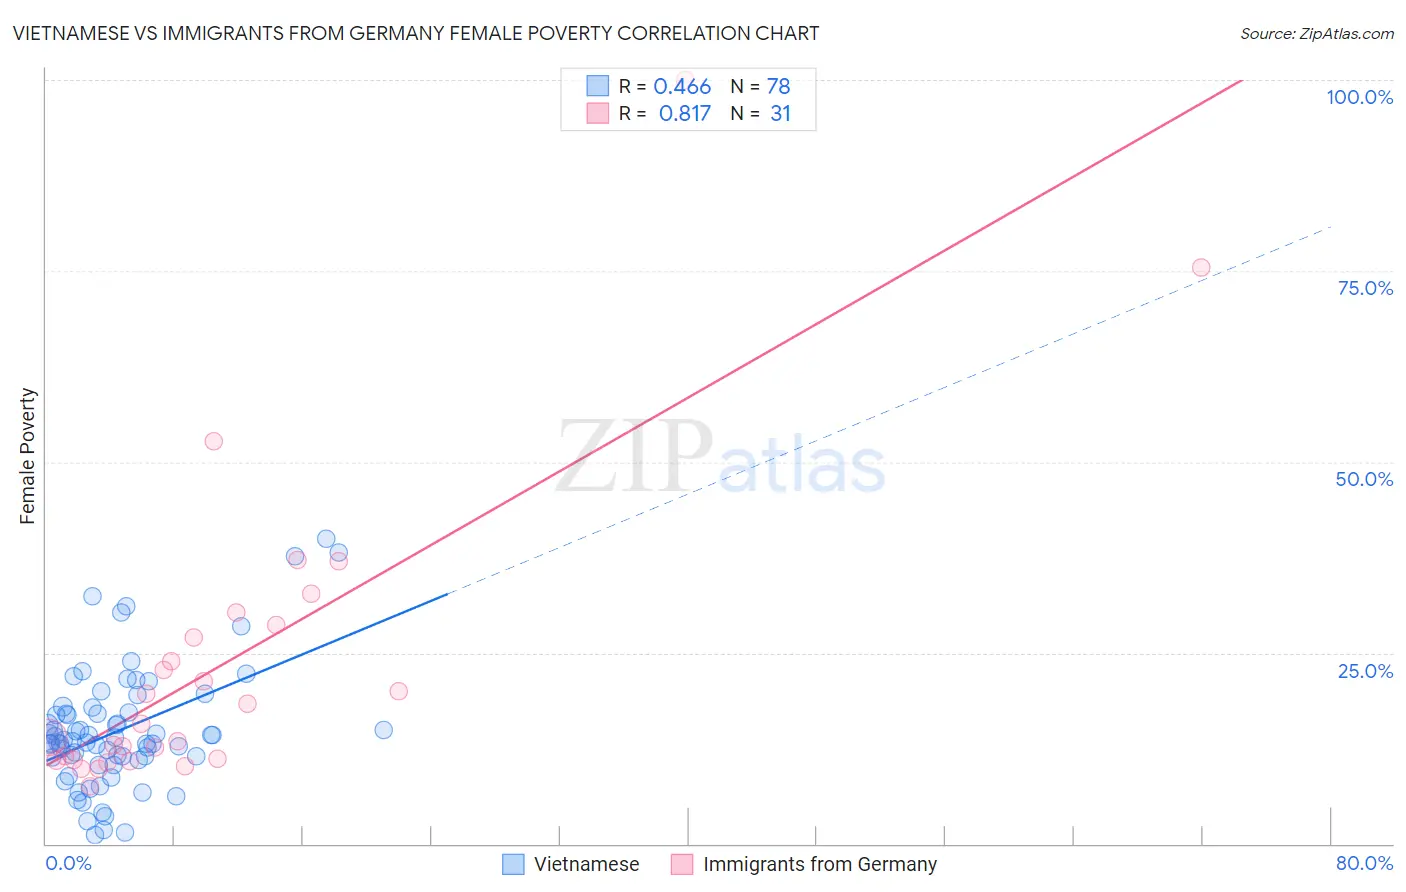
Vietnamese vs Immigrants from Germany Female Poverty Correlation Chart
The statistical analysis conducted on geographies consisting of 170,651,264 people shows a moderate positive correlation between the proportion of Vietnamese and poverty level among females in the United States with a correlation coefficient (R) of 0.466 and weighted average of 16.1%. Similarly, the statistical analysis conducted on geographies consisting of 463,610,140 people shows a very strong positive correlation between the proportion of Immigrants from Germany and poverty level among females in the United States with a correlation coefficient (R) of 0.817 and weighted average of 13.1%, a difference of 23.1%.
Female Poverty Correlation Summary
| Measurement | Vietnamese | Immigrants from Germany |
| Minimum | 1.2% | 7.5% |
| Maximum | 39.9% | 100.0% |
| Range | 38.7% | 92.5% |
| Mean | 14.9% | 23.6% |
| Median | 13.5% | 15.7% |
| Interquartile 25% (IQ1) | 11.2% | 10.9% |
| Interquartile 75% (IQ3) | 17.2% | 28.6% |
| Interquartile Range (IQR) | 6.0% | 17.6% |
| Standard Deviation (Sample) | 8.0% | 20.3% |
| Standard Deviation (Population) | 7.9% | 20.0% |
Similar Demographics by Female Poverty
Demographics Similar to Vietnamese by Female Poverty
In terms of female poverty, the demographic groups most similar to Vietnamese are West Indian (16.1%, a difference of 0.020%), Immigrants from Haiti (16.1%, a difference of 0.17%), Immigrants from Bahamas (16.1%, a difference of 0.24%), Immigrants from Cuba (16.1%, a difference of 0.26%), and Spanish American (16.2%, a difference of 0.31%).
| Demographics | Rating | Rank | Female Poverty |
| Haitians | 0.0 /100 | #273 | Tragic 15.9% |
| Barbadians | 0.0 /100 | #274 | Tragic 15.9% |
| Immigrants | Barbados | 0.0 /100 | #275 | Tragic 16.0% |
| Central Americans | 0.0 /100 | #276 | Tragic 16.0% |
| Bangladeshis | 0.0 /100 | #277 | Tragic 16.0% |
| Immigrants | West Indies | 0.0 /100 | #278 | Tragic 16.1% |
| Immigrants | Bahamas | 0.0 /100 | #279 | Tragic 16.1% |
| Vietnamese | 0.0 /100 | #280 | Tragic 16.1% |
| West Indians | 0.0 /100 | #281 | Tragic 16.1% |
| Immigrants | Haiti | 0.0 /100 | #282 | Tragic 16.1% |
| Immigrants | Cuba | 0.0 /100 | #283 | Tragic 16.1% |
| Spanish Americans | 0.0 /100 | #284 | Tragic 16.2% |
| Comanche | 0.0 /100 | #285 | Tragic 16.2% |
| Inupiat | 0.0 /100 | #286 | Tragic 16.2% |
| Immigrants | Belize | 0.0 /100 | #287 | Tragic 16.3% |
Demographics Similar to Immigrants from Germany by Female Poverty
In terms of female poverty, the demographic groups most similar to Immigrants from Germany are Tsimshian (13.1%, a difference of 0.070%), Taiwanese (13.1%, a difference of 0.10%), Samoan (13.1%, a difference of 0.17%), Yugoslavian (13.1%, a difference of 0.26%), and Immigrants from Fiji (13.2%, a difference of 0.49%).
| Demographics | Rating | Rank | Female Poverty |
| Afghans | 79.8 /100 | #144 | Good 13.0% |
| Syrians | 79.6 /100 | #145 | Good 13.0% |
| Immigrants | Peru | 79.1 /100 | #146 | Good 13.0% |
| Immigrants | Kazakhstan | 78.6 /100 | #147 | Good 13.0% |
| Yugoslavians | 76.9 /100 | #148 | Good 13.1% |
| Taiwanese | 75.7 /100 | #149 | Good 13.1% |
| Tsimshian | 75.5 /100 | #150 | Good 13.1% |
| Immigrants | Germany | 74.9 /100 | #151 | Good 13.1% |
| Samoans | 73.6 /100 | #152 | Good 13.1% |
| Immigrants | Fiji | 71.0 /100 | #153 | Good 13.2% |
| Armenians | 70.4 /100 | #154 | Good 13.2% |
| Hungarians | 70.1 /100 | #155 | Good 13.2% |
| Immigrants | Bosnia and Herzegovina | 69.7 /100 | #156 | Good 13.2% |
| Immigrants | Northern Africa | 68.8 /100 | #157 | Good 13.2% |
| Pennsylvania Germans | 67.3 /100 | #158 | Good 13.2% |