Somali vs Immigrants from Germany Female Poverty
COMPARE
Somali
Immigrants from Germany
Female Poverty
Female Poverty Comparison
Somalis
Immigrants from Germany
16.6%
FEMALE POVERTY
0.0/ 100
METRIC RATING
298th/ 347
METRIC RANK
13.1%
FEMALE POVERTY
74.9/ 100
METRIC RATING
151st/ 347
METRIC RANK
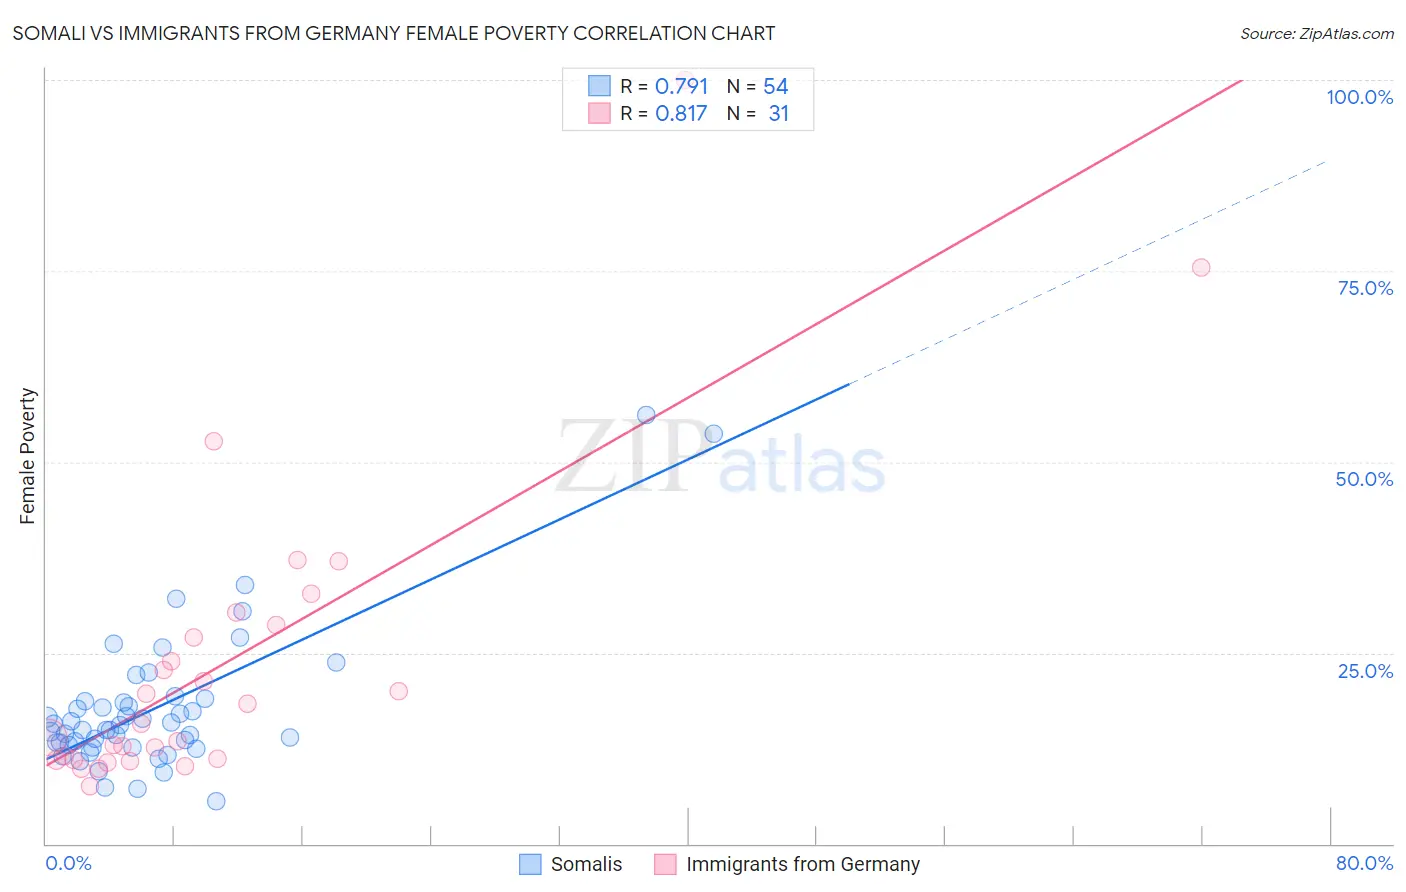
Somali vs Immigrants from Germany Female Poverty Correlation Chart
The statistical analysis conducted on geographies consisting of 99,282,230 people shows a strong positive correlation between the proportion of Somalis and poverty level among females in the United States with a correlation coefficient (R) of 0.791 and weighted average of 16.6%. Similarly, the statistical analysis conducted on geographies consisting of 463,610,140 people shows a very strong positive correlation between the proportion of Immigrants from Germany and poverty level among females in the United States with a correlation coefficient (R) of 0.817 and weighted average of 13.1%, a difference of 26.5%.
Female Poverty Correlation Summary
| Measurement | Somali | Immigrants from Germany |
| Minimum | 5.5% | 7.5% |
| Maximum | 56.1% | 100.0% |
| Range | 50.6% | 92.5% |
| Mean | 17.8% | 23.6% |
| Median | 15.2% | 15.7% |
| Interquartile 25% (IQ1) | 13.0% | 10.9% |
| Interquartile 75% (IQ3) | 18.6% | 28.6% |
| Interquartile Range (IQR) | 5.6% | 17.6% |
| Standard Deviation (Sample) | 9.4% | 20.3% |
| Standard Deviation (Population) | 9.3% | 20.0% |
Similar Demographics by Female Poverty
Demographics Similar to Somalis by Female Poverty
In terms of female poverty, the demographic groups most similar to Somalis are Mexican (16.5%, a difference of 0.20%), Hispanic or Latino (16.6%, a difference of 0.52%), Bahamian (16.6%, a difference of 0.56%), Immigrants from Senegal (16.5%, a difference of 0.60%), and Senegalese (16.5%, a difference of 0.62%).
| Demographics | Rating | Rank | Female Poverty |
| Yaqui | 0.0 /100 | #291 | Tragic 16.4% |
| Immigrants | Zaire | 0.0 /100 | #292 | Tragic 16.4% |
| Immigrants | Latin America | 0.0 /100 | #293 | Tragic 16.4% |
| Immigrants | Cabo Verde | 0.0 /100 | #294 | Tragic 16.4% |
| Senegalese | 0.0 /100 | #295 | Tragic 16.5% |
| Immigrants | Senegal | 0.0 /100 | #296 | Tragic 16.5% |
| Mexicans | 0.0 /100 | #297 | Tragic 16.5% |
| Somalis | 0.0 /100 | #298 | Tragic 16.6% |
| Hispanics or Latinos | 0.0 /100 | #299 | Tragic 16.6% |
| Bahamians | 0.0 /100 | #300 | Tragic 16.6% |
| Guatemalans | 0.0 /100 | #301 | Tragic 16.7% |
| Chippewa | 0.0 /100 | #302 | Tragic 16.7% |
| Choctaw | 0.0 /100 | #303 | Tragic 16.8% |
| Immigrants | Central America | 0.0 /100 | #304 | Tragic 16.8% |
| Immigrants | Grenada | 0.0 /100 | #305 | Tragic 16.8% |
Demographics Similar to Immigrants from Germany by Female Poverty
In terms of female poverty, the demographic groups most similar to Immigrants from Germany are Tsimshian (13.1%, a difference of 0.070%), Taiwanese (13.1%, a difference of 0.10%), Samoan (13.1%, a difference of 0.17%), Yugoslavian (13.1%, a difference of 0.26%), and Immigrants from Fiji (13.2%, a difference of 0.49%).
| Demographics | Rating | Rank | Female Poverty |
| Afghans | 79.8 /100 | #144 | Good 13.0% |
| Syrians | 79.6 /100 | #145 | Good 13.0% |
| Immigrants | Peru | 79.1 /100 | #146 | Good 13.0% |
| Immigrants | Kazakhstan | 78.6 /100 | #147 | Good 13.0% |
| Yugoslavians | 76.9 /100 | #148 | Good 13.1% |
| Taiwanese | 75.7 /100 | #149 | Good 13.1% |
| Tsimshian | 75.5 /100 | #150 | Good 13.1% |
| Immigrants | Germany | 74.9 /100 | #151 | Good 13.1% |
| Samoans | 73.6 /100 | #152 | Good 13.1% |
| Immigrants | Fiji | 71.0 /100 | #153 | Good 13.2% |
| Armenians | 70.4 /100 | #154 | Good 13.2% |
| Hungarians | 70.1 /100 | #155 | Good 13.2% |
| Immigrants | Bosnia and Herzegovina | 69.7 /100 | #156 | Good 13.2% |
| Immigrants | Northern Africa | 68.8 /100 | #157 | Good 13.2% |
| Pennsylvania Germans | 67.3 /100 | #158 | Good 13.2% |