Crow vs Turkish Child Poverty Among Girls Under 16
COMPARE
Crow
Turkish
Child Poverty Among Girls Under 16
Child Poverty Among Girls Under 16 Comparison
Crow
Turks
26.4%
CHILD POVERTY AMONG GIRLS UNDER 16
0.0/ 100
METRIC RATING
339th/ 347
METRIC RANK
13.7%
CHILD POVERTY AMONG GIRLS UNDER 16
99.7/ 100
METRIC RATING
31st/ 347
METRIC RANK
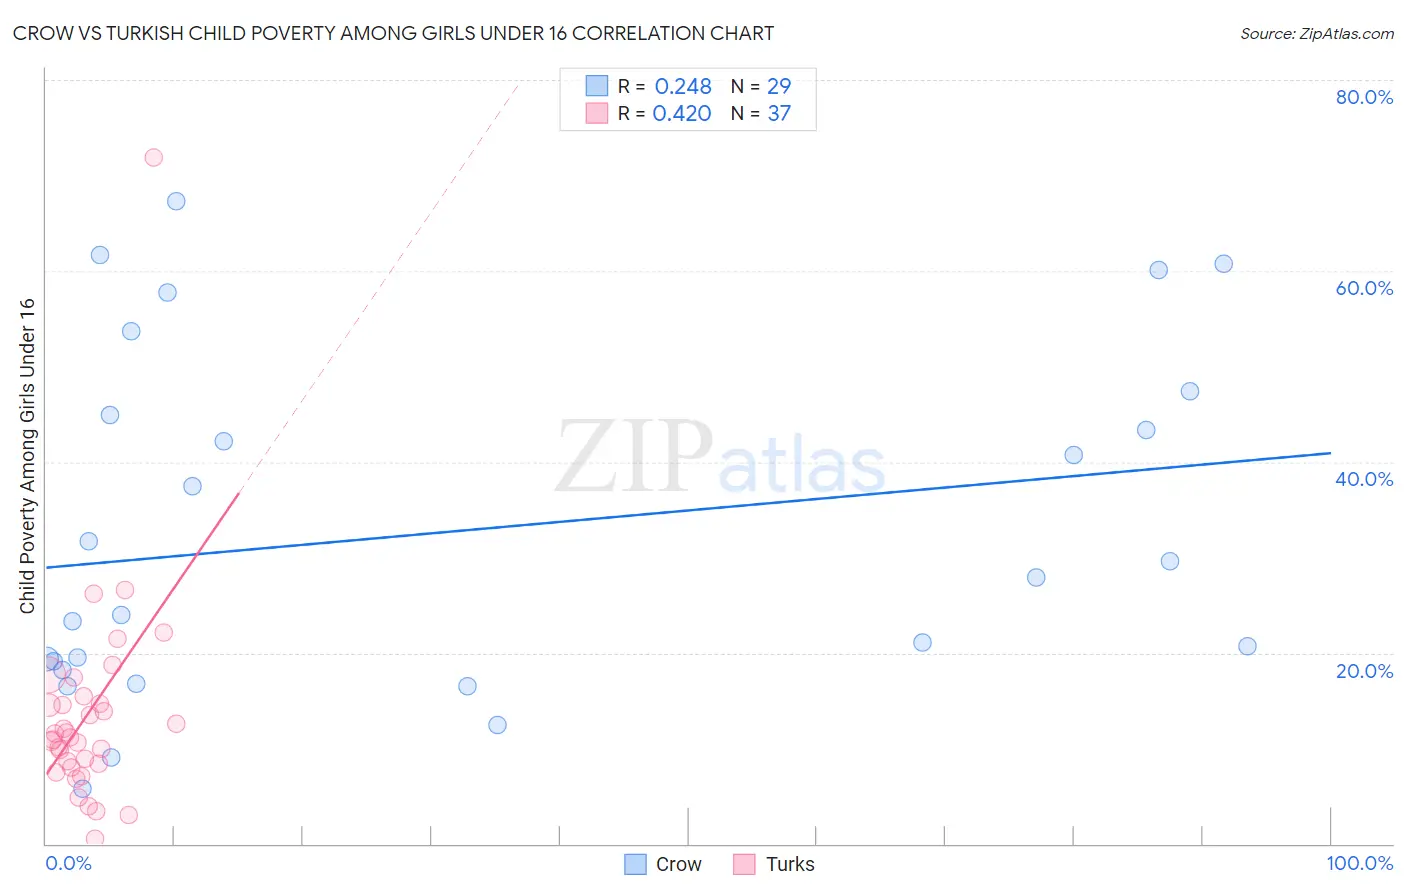
Crow vs Turkish Child Poverty Among Girls Under 16 Correlation Chart
The statistical analysis conducted on geographies consisting of 59,004,604 people shows a weak positive correlation between the proportion of Crow and poverty level among girls under the age of 16 in the United States with a correlation coefficient (R) of 0.248 and weighted average of 26.4%. Similarly, the statistical analysis conducted on geographies consisting of 267,627,928 people shows a moderate positive correlation between the proportion of Turks and poverty level among girls under the age of 16 in the United States with a correlation coefficient (R) of 0.420 and weighted average of 13.7%, a difference of 92.6%.
Child Poverty Among Girls Under 16 Correlation Summary
| Measurement | Crow | Turkish |
| Minimum | 5.8% | 0.50% |
| Maximum | 67.4% | 71.9% |
| Range | 61.6% | 71.4% |
| Mean | 32.7% | 13.5% |
| Median | 27.9% | 11.2% |
| Interquartile 25% (IQ1) | 18.7% | 8.2% |
| Interquartile 75% (IQ3) | 46.2% | 15.1% |
| Interquartile Range (IQR) | 27.5% | 6.9% |
| Standard Deviation (Sample) | 17.9% | 11.5% |
| Standard Deviation (Population) | 17.6% | 11.4% |
Similar Demographics by Child Poverty Among Girls Under 16
Demographics Similar to Crow by Child Poverty Among Girls Under 16
In terms of child poverty among girls under 16, the demographic groups most similar to Crow are Cheyenne (26.3%, a difference of 0.34%), Yup'ik (25.8%, a difference of 2.1%), Yuman (27.1%, a difference of 2.7%), Sioux (25.6%, a difference of 3.1%), and Pueblo (25.2%, a difference of 4.6%).
| Demographics | Rating | Rank | Child Poverty Among Girls Under 16 |
| Natives/Alaskans | 0.0 /100 | #332 | Tragic 24.0% |
| Blacks/African Americans | 0.0 /100 | #333 | Tragic 24.7% |
| Menominee | 0.0 /100 | #334 | Tragic 25.0% |
| Pueblo | 0.0 /100 | #335 | Tragic 25.2% |
| Sioux | 0.0 /100 | #336 | Tragic 25.6% |
| Yup'ik | 0.0 /100 | #337 | Tragic 25.8% |
| Cheyenne | 0.0 /100 | #338 | Tragic 26.3% |
| Crow | 0.0 /100 | #339 | Tragic 26.4% |
| Yuman | 0.0 /100 | #340 | Tragic 27.1% |
| Hopi | 0.0 /100 | #341 | Tragic 27.9% |
| Pima | 0.0 /100 | #342 | Tragic 28.2% |
| Immigrants | Yemen | 0.0 /100 | #343 | Tragic 29.5% |
| Navajo | 0.0 /100 | #344 | Tragic 30.5% |
| Lumbee | 0.0 /100 | #345 | Tragic 30.7% |
| Tohono O'odham | 0.0 /100 | #346 | Tragic 31.6% |
Demographics Similar to Turks by Child Poverty Among Girls Under 16
In terms of child poverty among girls under 16, the demographic groups most similar to Turks are Danish (13.7%, a difference of 0.040%), Swedish (13.7%, a difference of 0.070%), Asian (13.7%, a difference of 0.12%), Maltese (13.7%, a difference of 0.13%), and Bolivian (13.6%, a difference of 0.79%).
| Demographics | Rating | Rank | Child Poverty Among Girls Under 16 |
| Immigrants | Eastern Asia | 99.9 /100 | #24 | Exceptional 13.4% |
| Immigrants | China | 99.8 /100 | #25 | Exceptional 13.4% |
| Eastern Europeans | 99.8 /100 | #26 | Exceptional 13.5% |
| Latvians | 99.8 /100 | #27 | Exceptional 13.5% |
| Tongans | 99.8 /100 | #28 | Exceptional 13.6% |
| Bolivians | 99.8 /100 | #29 | Exceptional 13.6% |
| Asians | 99.7 /100 | #30 | Exceptional 13.7% |
| Turks | 99.7 /100 | #31 | Exceptional 13.7% |
| Danes | 99.7 /100 | #32 | Exceptional 13.7% |
| Swedes | 99.7 /100 | #33 | Exceptional 13.7% |
| Maltese | 99.7 /100 | #34 | Exceptional 13.7% |
| Immigrants | Northern Europe | 99.6 /100 | #35 | Exceptional 13.8% |
| Russians | 99.6 /100 | #36 | Exceptional 13.9% |
| Lithuanians | 99.6 /100 | #37 | Exceptional 13.9% |
| Immigrants | Moldova | 99.6 /100 | #38 | Exceptional 13.9% |