Crow vs Turkish Currently Married
COMPARE
Crow
Turkish
Currently Married
Currently Married Comparison
Crow
Turks
40.4%
CURRENTLY MARRIED
0.0/ 100
METRIC RATING
329th/ 347
METRIC RANK
47.8%
CURRENTLY MARRIED
93.9/ 100
METRIC RATING
102nd/ 347
METRIC RANK
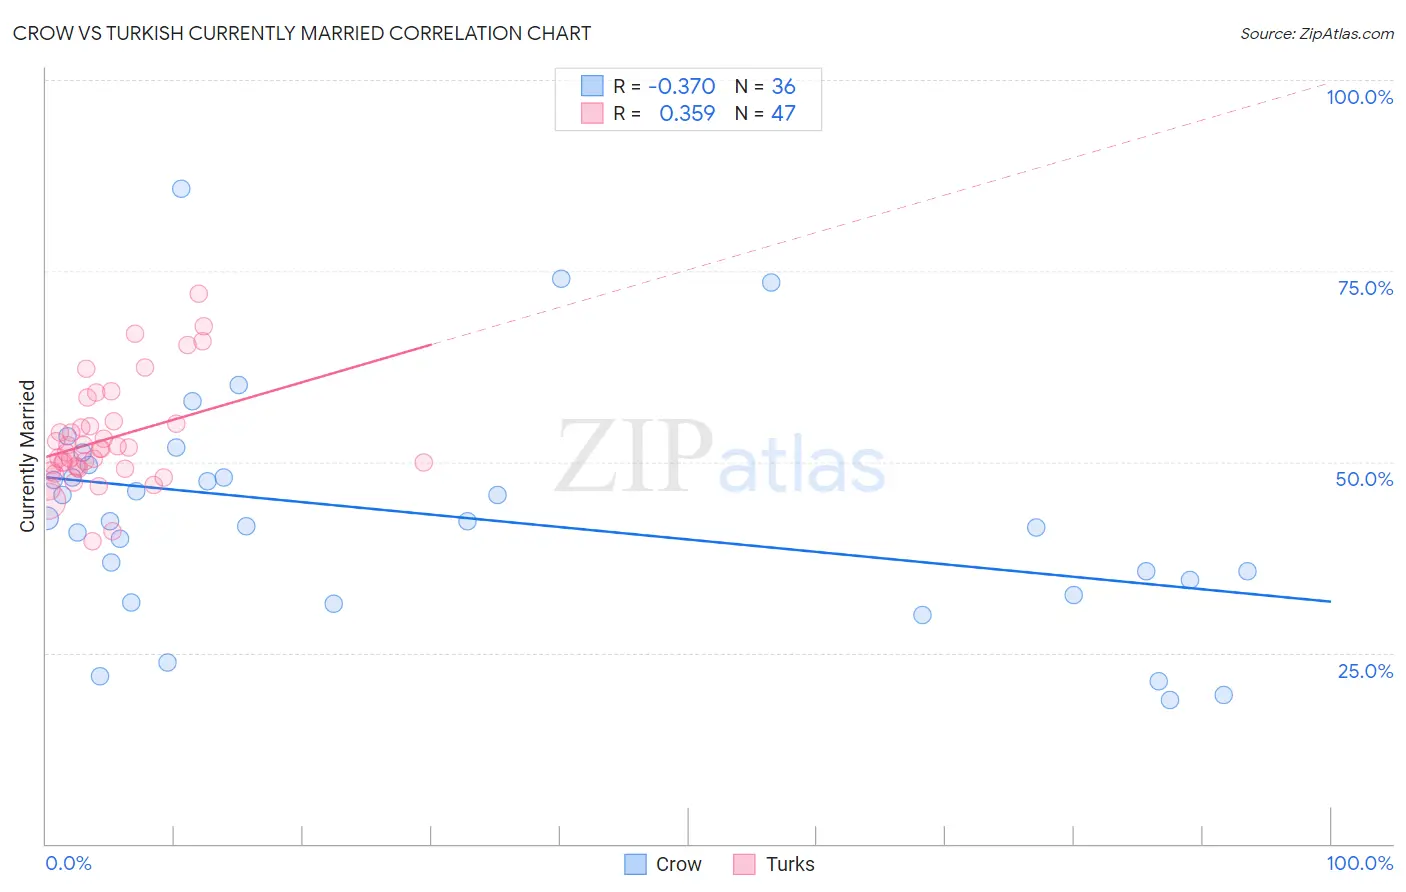
Crow vs Turkish Currently Married Correlation Chart
The statistical analysis conducted on geographies consisting of 59,208,662 people shows a mild negative correlation between the proportion of Crow and percentage of population currently married in the United States with a correlation coefficient (R) of -0.370 and weighted average of 40.4%. Similarly, the statistical analysis conducted on geographies consisting of 271,815,106 people shows a mild positive correlation between the proportion of Turks and percentage of population currently married in the United States with a correlation coefficient (R) of 0.359 and weighted average of 47.8%, a difference of 18.4%.
Currently Married Correlation Summary
| Measurement | Crow | Turkish |
| Minimum | 18.8% | 39.7% |
| Maximum | 85.8% | 72.0% |
| Range | 67.0% | 32.3% |
| Mean | 43.0% | 53.0% |
| Median | 42.2% | 51.8% |
| Interquartile 25% (IQ1) | 33.5% | 49.1% |
| Interquartile 75% (IQ3) | 48.8% | 55.0% |
| Interquartile Range (IQR) | 15.3% | 5.9% |
| Standard Deviation (Sample) | 15.0% | 6.8% |
| Standard Deviation (Population) | 14.8% | 6.7% |
Similar Demographics by Currently Married
Demographics Similar to Crow by Currently Married
In terms of currently married, the demographic groups most similar to Crow are Immigrants from Dominica (40.3%, a difference of 0.090%), Immigrants from Barbados (40.3%, a difference of 0.10%), Arapaho (40.5%, a difference of 0.43%), Senegalese (40.6%, a difference of 0.47%), and Barbadian (40.6%, a difference of 0.65%).
| Demographics | Rating | Rank | Currently Married |
| Immigrants | Haiti | 0.0 /100 | #322 | Tragic 41.0% |
| Immigrants | West Indies | 0.0 /100 | #323 | Tragic 40.7% |
| Immigrants | Senegal | 0.0 /100 | #324 | Tragic 40.7% |
| U.S. Virgin Islanders | 0.0 /100 | #325 | Tragic 40.7% |
| Barbadians | 0.0 /100 | #326 | Tragic 40.6% |
| Senegalese | 0.0 /100 | #327 | Tragic 40.6% |
| Arapaho | 0.0 /100 | #328 | Tragic 40.5% |
| Crow | 0.0 /100 | #329 | Tragic 40.4% |
| Immigrants | Dominica | 0.0 /100 | #330 | Tragic 40.3% |
| Immigrants | Barbados | 0.0 /100 | #331 | Tragic 40.3% |
| Immigrants | St. Vincent and the Grenadines | 0.0 /100 | #332 | Tragic 40.1% |
| Yup'ik | 0.0 /100 | #333 | Tragic 39.9% |
| Puerto Ricans | 0.0 /100 | #334 | Tragic 39.9% |
| Lumbee | 0.0 /100 | #335 | Tragic 39.8% |
| British West Indians | 0.0 /100 | #336 | Tragic 39.8% |
Demographics Similar to Turks by Currently Married
In terms of currently married, the demographic groups most similar to Turks are Immigrants from Germany (47.8%, a difference of 0.020%), Cypriot (47.8%, a difference of 0.030%), Celtic (47.8%, a difference of 0.040%), Serbian (47.8%, a difference of 0.050%), and Immigrants from Sweden (47.8%, a difference of 0.060%).
| Demographics | Rating | Rank | Currently Married |
| Immigrants | Bulgaria | 94.8 /100 | #95 | Exceptional 47.9% |
| Egyptians | 94.8 /100 | #96 | Exceptional 47.9% |
| Immigrants | Ukraine | 94.8 /100 | #97 | Exceptional 47.9% |
| Immigrants | China | 94.7 /100 | #98 | Exceptional 47.9% |
| Immigrants | Sweden | 94.3 /100 | #99 | Exceptional 47.8% |
| Celtics | 94.2 /100 | #100 | Exceptional 47.8% |
| Immigrants | Germany | 94.1 /100 | #101 | Exceptional 47.8% |
| Turks | 93.9 /100 | #102 | Exceptional 47.8% |
| Cypriots | 93.7 /100 | #103 | Exceptional 47.8% |
| Serbians | 93.6 /100 | #104 | Exceptional 47.8% |
| Immigrants | Singapore | 93.3 /100 | #105 | Exceptional 47.8% |
| Immigrants | Greece | 93.1 /100 | #106 | Exceptional 47.7% |
| Immigrants | Italy | 92.9 /100 | #107 | Exceptional 47.7% |
| Tsimshian | 92.4 /100 | #108 | Exceptional 47.7% |
| Immigrants | Egypt | 92.3 /100 | #109 | Exceptional 47.7% |