Crow vs Somali Child Poverty Among Girls Under 16
COMPARE
Crow
Somali
Child Poverty Among Girls Under 16
Child Poverty Among Girls Under 16 Comparison
Crow
Somalis
26.4%
CHILD POVERTY AMONG GIRLS UNDER 16
0.0/ 100
METRIC RATING
339th/ 347
METRIC RANK
21.0%
CHILD POVERTY AMONG GIRLS UNDER 16
0.0/ 100
METRIC RATING
300th/ 347
METRIC RANK
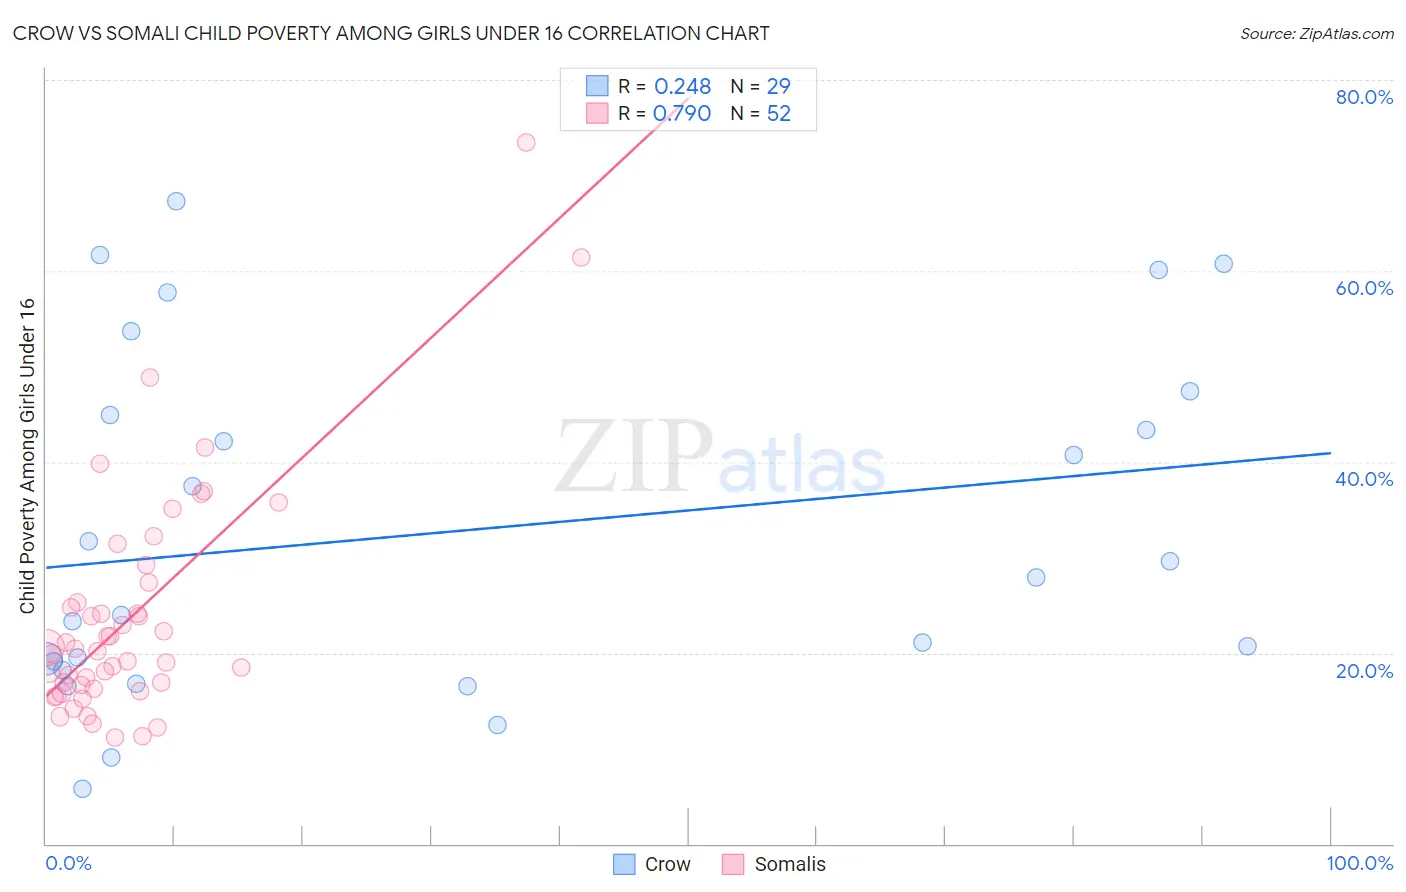
Crow vs Somali Child Poverty Among Girls Under 16 Correlation Chart
The statistical analysis conducted on geographies consisting of 59,004,604 people shows a weak positive correlation between the proportion of Crow and poverty level among girls under the age of 16 in the United States with a correlation coefficient (R) of 0.248 and weighted average of 26.4%. Similarly, the statistical analysis conducted on geographies consisting of 99,045,877 people shows a strong positive correlation between the proportion of Somalis and poverty level among girls under the age of 16 in the United States with a correlation coefficient (R) of 0.790 and weighted average of 21.0%, a difference of 25.5%.
Child Poverty Among Girls Under 16 Correlation Summary
| Measurement | Crow | Somali |
| Minimum | 5.8% | 11.1% |
| Maximum | 67.4% | 73.5% |
| Range | 61.6% | 62.4% |
| Mean | 32.7% | 23.9% |
| Median | 27.9% | 20.3% |
| Interquartile 25% (IQ1) | 18.7% | 16.4% |
| Interquartile 75% (IQ3) | 46.2% | 26.3% |
| Interquartile Range (IQR) | 27.5% | 9.9% |
| Standard Deviation (Sample) | 17.9% | 12.2% |
| Standard Deviation (Population) | 17.6% | 12.1% |
Similar Demographics by Child Poverty Among Girls Under 16
Demographics Similar to Crow by Child Poverty Among Girls Under 16
In terms of child poverty among girls under 16, the demographic groups most similar to Crow are Cheyenne (26.3%, a difference of 0.34%), Yup'ik (25.8%, a difference of 2.1%), Yuman (27.1%, a difference of 2.7%), Sioux (25.6%, a difference of 3.1%), and Pueblo (25.2%, a difference of 4.6%).
| Demographics | Rating | Rank | Child Poverty Among Girls Under 16 |
| Natives/Alaskans | 0.0 /100 | #332 | Tragic 24.0% |
| Blacks/African Americans | 0.0 /100 | #333 | Tragic 24.7% |
| Menominee | 0.0 /100 | #334 | Tragic 25.0% |
| Pueblo | 0.0 /100 | #335 | Tragic 25.2% |
| Sioux | 0.0 /100 | #336 | Tragic 25.6% |
| Yup'ik | 0.0 /100 | #337 | Tragic 25.8% |
| Cheyenne | 0.0 /100 | #338 | Tragic 26.3% |
| Crow | 0.0 /100 | #339 | Tragic 26.4% |
| Yuman | 0.0 /100 | #340 | Tragic 27.1% |
| Hopi | 0.0 /100 | #341 | Tragic 27.9% |
| Pima | 0.0 /100 | #342 | Tragic 28.2% |
| Immigrants | Yemen | 0.0 /100 | #343 | Tragic 29.5% |
| Navajo | 0.0 /100 | #344 | Tragic 30.5% |
| Lumbee | 0.0 /100 | #345 | Tragic 30.7% |
| Tohono O'odham | 0.0 /100 | #346 | Tragic 31.6% |
Demographics Similar to Somalis by Child Poverty Among Girls Under 16
In terms of child poverty among girls under 16, the demographic groups most similar to Somalis are Hispanic or Latino (21.0%, a difference of 0.31%), Choctaw (21.1%, a difference of 0.62%), Mexican (20.9%, a difference of 0.72%), Seminole (21.2%, a difference of 0.73%), and British West Indian (21.3%, a difference of 1.2%).
| Demographics | Rating | Rank | Child Poverty Among Girls Under 16 |
| Immigrants | Grenada | 0.0 /100 | #293 | Tragic 20.7% |
| Immigrants | Senegal | 0.0 /100 | #294 | Tragic 20.7% |
| Immigrants | Caribbean | 0.0 /100 | #295 | Tragic 20.7% |
| Immigrants | West Indies | 0.0 /100 | #296 | Tragic 20.7% |
| Inupiat | 0.0 /100 | #297 | Tragic 20.8% |
| Mexicans | 0.0 /100 | #298 | Tragic 20.9% |
| Hispanics or Latinos | 0.0 /100 | #299 | Tragic 21.0% |
| Somalis | 0.0 /100 | #300 | Tragic 21.0% |
| Choctaw | 0.0 /100 | #301 | Tragic 21.1% |
| Seminole | 0.0 /100 | #302 | Tragic 21.2% |
| British West Indians | 0.0 /100 | #303 | Tragic 21.3% |
| Indonesians | 0.0 /100 | #304 | Tragic 21.3% |
| Guatemalans | 0.0 /100 | #305 | Tragic 21.4% |
| Immigrants | Central America | 0.0 /100 | #306 | Tragic 21.4% |
| Immigrants | Bahamas | 0.0 /100 | #307 | Tragic 21.4% |