Crow vs Immigrants from Dominican Republic Child Poverty Among Girls Under 16
COMPARE
Crow
Immigrants from Dominican Republic
Child Poverty Among Girls Under 16
Child Poverty Among Girls Under 16 Comparison
Crow
Immigrants from Dominican Republic
26.4%
CHILD POVERTY AMONG GIRLS UNDER 16
0.0/ 100
METRIC RATING
339th/ 347
METRIC RANK
23.8%
CHILD POVERTY AMONG GIRLS UNDER 16
0.0/ 100
METRIC RATING
330th/ 347
METRIC RANK
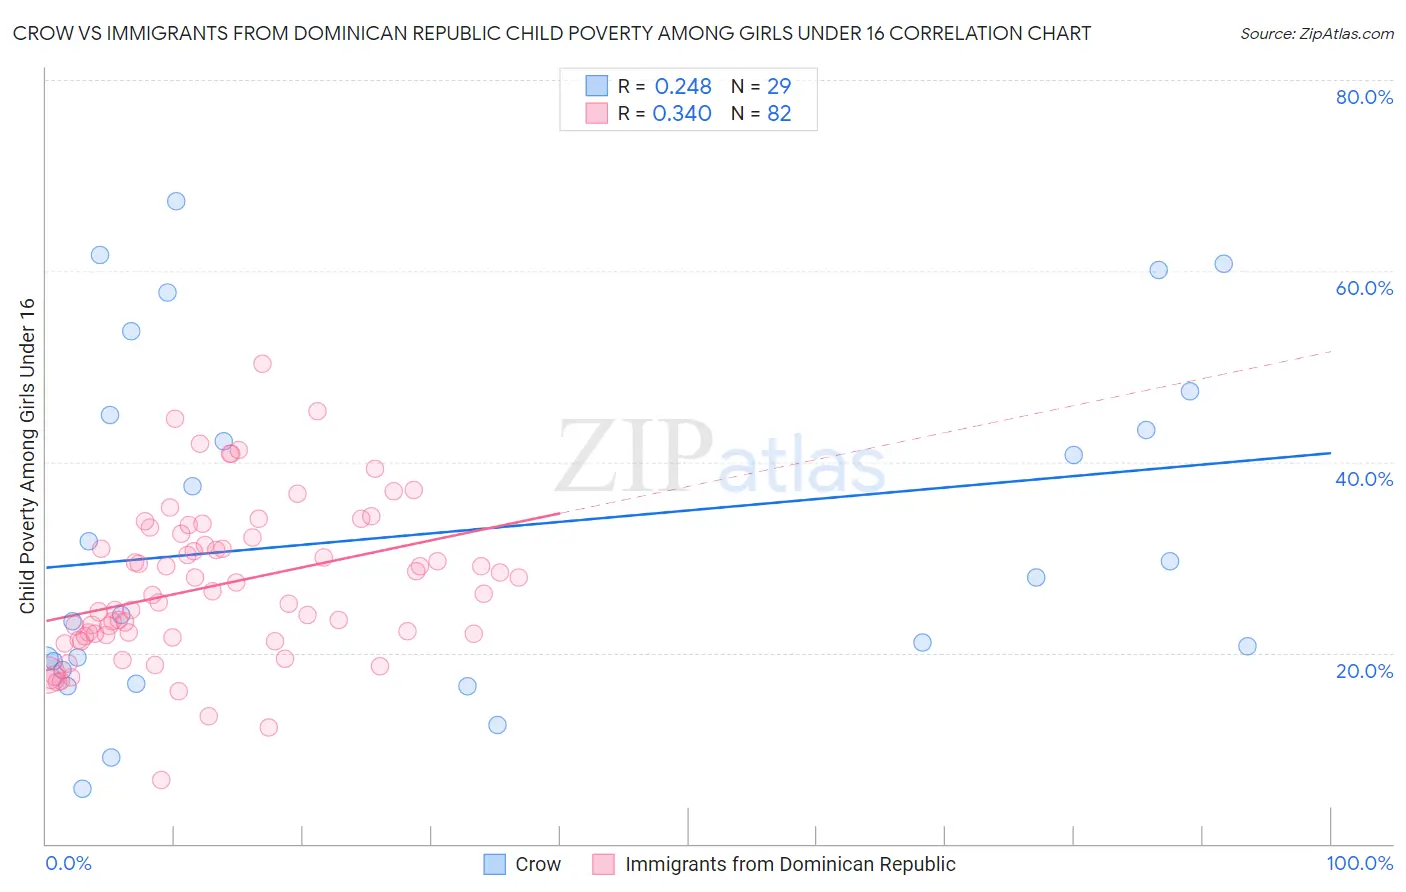
Crow vs Immigrants from Dominican Republic Child Poverty Among Girls Under 16 Correlation Chart
The statistical analysis conducted on geographies consisting of 59,004,604 people shows a weak positive correlation between the proportion of Crow and poverty level among girls under the age of 16 in the United States with a correlation coefficient (R) of 0.248 and weighted average of 26.4%. Similarly, the statistical analysis conducted on geographies consisting of 271,039,828 people shows a mild positive correlation between the proportion of Immigrants from Dominican Republic and poverty level among girls under the age of 16 in the United States with a correlation coefficient (R) of 0.340 and weighted average of 23.8%, a difference of 10.7%.
Child Poverty Among Girls Under 16 Correlation Summary
| Measurement | Crow | Immigrants from Dominican Republic |
| Minimum | 5.8% | 6.6% |
| Maximum | 67.4% | 50.3% |
| Range | 61.6% | 43.6% |
| Mean | 32.7% | 27.0% |
| Median | 27.9% | 26.1% |
| Interquartile 25% (IQ1) | 18.7% | 21.7% |
| Interquartile 75% (IQ3) | 46.2% | 32.1% |
| Interquartile Range (IQR) | 27.5% | 10.4% |
| Standard Deviation (Sample) | 17.9% | 8.1% |
| Standard Deviation (Population) | 17.6% | 8.1% |
Demographics Similar to Crow and Immigrants from Dominican Republic by Child Poverty Among Girls Under 16
In terms of child poverty among girls under 16, the demographic groups most similar to Crow are Cheyenne (26.3%, a difference of 0.34%), Yup'ik (25.8%, a difference of 2.1%), Yuman (27.1%, a difference of 2.7%), Sioux (25.6%, a difference of 3.1%), and Pueblo (25.2%, a difference of 4.6%). Similarly, the demographic groups most similar to Immigrants from Dominican Republic are Apache (23.8%, a difference of 0.050%), Kiowa (23.7%, a difference of 0.54%), Dominican (23.7%, a difference of 0.65%), Native/Alaskan (24.0%, a difference of 0.91%), and Black/African American (24.7%, a difference of 3.5%).
| Demographics | Rating | Rank | Child Poverty Among Girls Under 16 |
| Paiute | 0.0 /100 | #324 | Tragic 22.6% |
| Immigrants | Congo | 0.0 /100 | #325 | Tragic 22.7% |
| Immigrants | Honduras | 0.0 /100 | #326 | Tragic 22.8% |
| Central American Indians | 0.0 /100 | #327 | Tragic 22.8% |
| Dominicans | 0.0 /100 | #328 | Tragic 23.7% |
| Kiowa | 0.0 /100 | #329 | Tragic 23.7% |
| Immigrants | Dominican Republic | 0.0 /100 | #330 | Tragic 23.8% |
| Apache | 0.0 /100 | #331 | Tragic 23.8% |
| Natives/Alaskans | 0.0 /100 | #332 | Tragic 24.0% |
| Blacks/African Americans | 0.0 /100 | #333 | Tragic 24.7% |
| Menominee | 0.0 /100 | #334 | Tragic 25.0% |
| Pueblo | 0.0 /100 | #335 | Tragic 25.2% |
| Sioux | 0.0 /100 | #336 | Tragic 25.6% |
| Yup'ik | 0.0 /100 | #337 | Tragic 25.8% |
| Cheyenne | 0.0 /100 | #338 | Tragic 26.3% |
| Crow | 0.0 /100 | #339 | Tragic 26.4% |
| Yuman | 0.0 /100 | #340 | Tragic 27.1% |
| Hopi | 0.0 /100 | #341 | Tragic 27.9% |
| Pima | 0.0 /100 | #342 | Tragic 28.2% |
| Immigrants | Yemen | 0.0 /100 | #343 | Tragic 29.5% |
| Navajo | 0.0 /100 | #344 | Tragic 30.5% |