Immigrants from Lithuania vs Turkish Child Poverty Among Girls Under 16
COMPARE
Immigrants from Lithuania
Turkish
Child Poverty Among Girls Under 16
Child Poverty Among Girls Under 16 Comparison
Immigrants from Lithuania
Turks
13.1%
CHILD POVERTY AMONG GIRLS UNDER 16
99.9/ 100
METRIC RATING
16th/ 347
METRIC RANK
13.7%
CHILD POVERTY AMONG GIRLS UNDER 16
99.7/ 100
METRIC RATING
31st/ 347
METRIC RANK
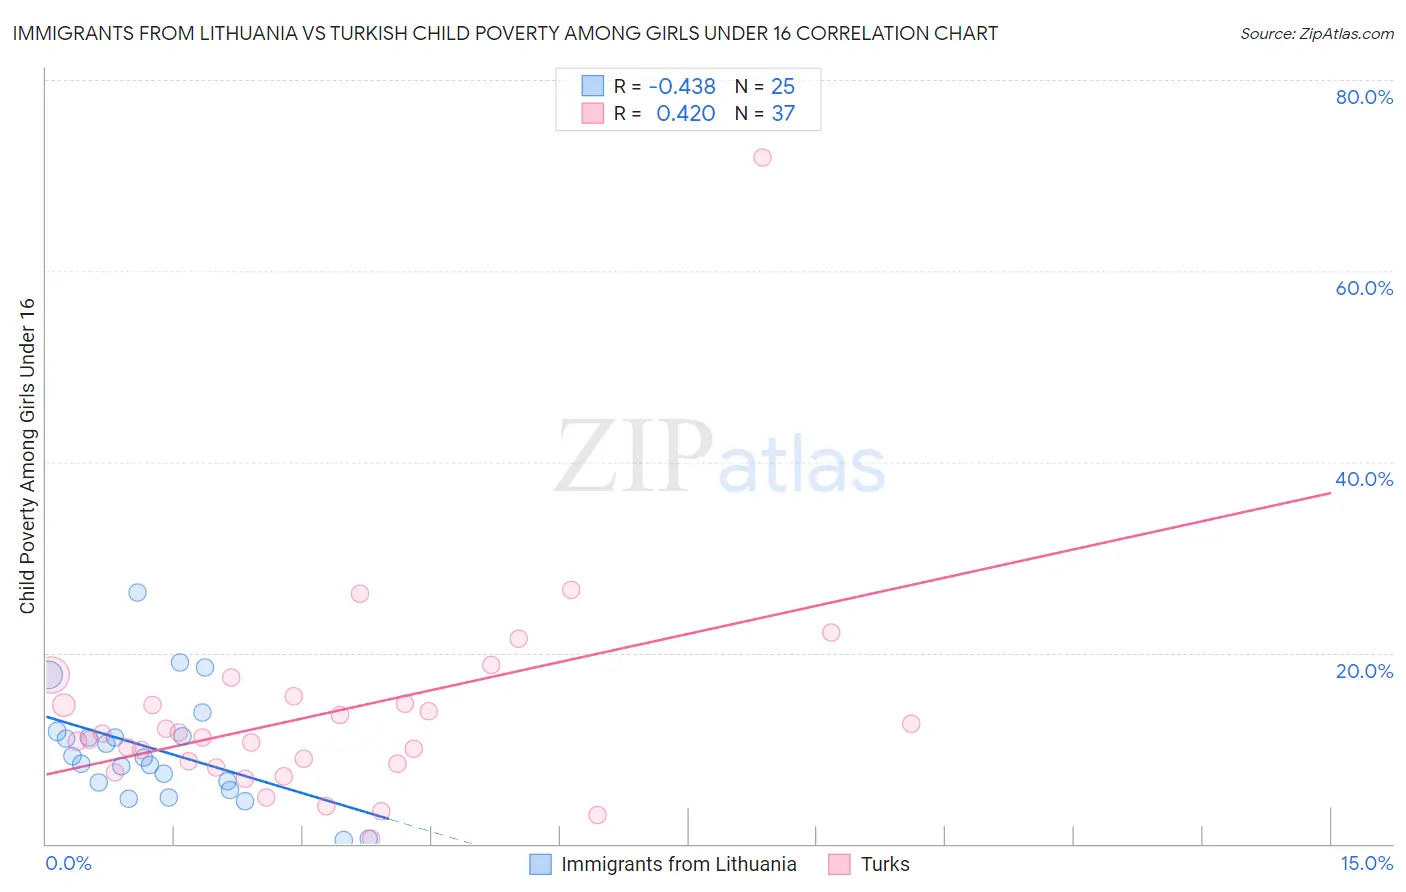
Immigrants from Lithuania vs Turkish Child Poverty Among Girls Under 16 Correlation Chart
The statistical analysis conducted on geographies consisting of 116,605,059 people shows a moderate negative correlation between the proportion of Immigrants from Lithuania and poverty level among girls under the age of 16 in the United States with a correlation coefficient (R) of -0.438 and weighted average of 13.1%. Similarly, the statistical analysis conducted on geographies consisting of 267,627,928 people shows a moderate positive correlation between the proportion of Turks and poverty level among girls under the age of 16 in the United States with a correlation coefficient (R) of 0.420 and weighted average of 13.7%, a difference of 4.2%.
Child Poverty Among Girls Under 16 Correlation Summary
| Measurement | Immigrants from Lithuania | Turkish |
| Minimum | 0.39% | 0.50% |
| Maximum | 26.3% | 71.9% |
| Range | 25.9% | 71.4% |
| Mean | 9.8% | 13.5% |
| Median | 9.0% | 11.2% |
| Interquartile 25% (IQ1) | 6.0% | 8.2% |
| Interquartile 75% (IQ3) | 11.5% | 15.1% |
| Interquartile Range (IQR) | 5.4% | 6.9% |
| Standard Deviation (Sample) | 5.9% | 11.5% |
| Standard Deviation (Population) | 5.7% | 11.4% |
Demographics Similar to Immigrants from Lithuania and Turks by Child Poverty Among Girls Under 16
In terms of child poverty among girls under 16, the demographic groups most similar to Immigrants from Lithuania are Bulgarian (13.1%, a difference of 0.080%), Immigrants from Korea (13.1%, a difference of 0.10%), Cypriot (13.2%, a difference of 0.47%), Okinawan (13.0%, a difference of 0.92%), and Burmese (13.0%, a difference of 0.93%). Similarly, the demographic groups most similar to Turks are Danish (13.7%, a difference of 0.040%), Swedish (13.7%, a difference of 0.070%), Asian (13.7%, a difference of 0.12%), Bolivian (13.6%, a difference of 0.79%), and Tongan (13.6%, a difference of 0.91%).
| Demographics | Rating | Rank | Child Poverty Among Girls Under 16 |
| Immigrants | Ireland | 99.9 /100 | #13 | Exceptional 12.9% |
| Burmese | 99.9 /100 | #14 | Exceptional 13.0% |
| Okinawans | 99.9 /100 | #15 | Exceptional 13.0% |
| Immigrants | Lithuania | 99.9 /100 | #16 | Exceptional 13.1% |
| Bulgarians | 99.9 /100 | #17 | Exceptional 13.1% |
| Immigrants | Korea | 99.9 /100 | #18 | Exceptional 13.1% |
| Cypriots | 99.9 /100 | #19 | Exceptional 13.2% |
| Immigrants | Japan | 99.9 /100 | #20 | Exceptional 13.3% |
| Assyrians/Chaldeans/Syriacs | 99.9 /100 | #21 | Exceptional 13.3% |
| Indians (Asian) | 99.9 /100 | #22 | Exceptional 13.3% |
| Norwegians | 99.9 /100 | #23 | Exceptional 13.3% |
| Immigrants | Eastern Asia | 99.9 /100 | #24 | Exceptional 13.4% |
| Immigrants | China | 99.8 /100 | #25 | Exceptional 13.4% |
| Eastern Europeans | 99.8 /100 | #26 | Exceptional 13.5% |
| Latvians | 99.8 /100 | #27 | Exceptional 13.5% |
| Tongans | 99.8 /100 | #28 | Exceptional 13.6% |
| Bolivians | 99.8 /100 | #29 | Exceptional 13.6% |
| Asians | 99.7 /100 | #30 | Exceptional 13.7% |
| Turks | 99.7 /100 | #31 | Exceptional 13.7% |
| Danes | 99.7 /100 | #32 | Exceptional 13.7% |
| Swedes | 99.7 /100 | #33 | Exceptional 13.7% |