Choctaw vs Costa Rican Single Female Poverty
COMPARE
Choctaw
Costa Rican
Single Female Poverty
Single Female Poverty Comparison
Choctaw
Costa Ricans
27.2%
SINGLE FEMALE POVERTY
0.0/ 100
METRIC RATING
325th/ 347
METRIC RANK
20.7%
SINGLE FEMALE POVERTY
71.8/ 100
METRIC RATING
159th/ 347
METRIC RANK
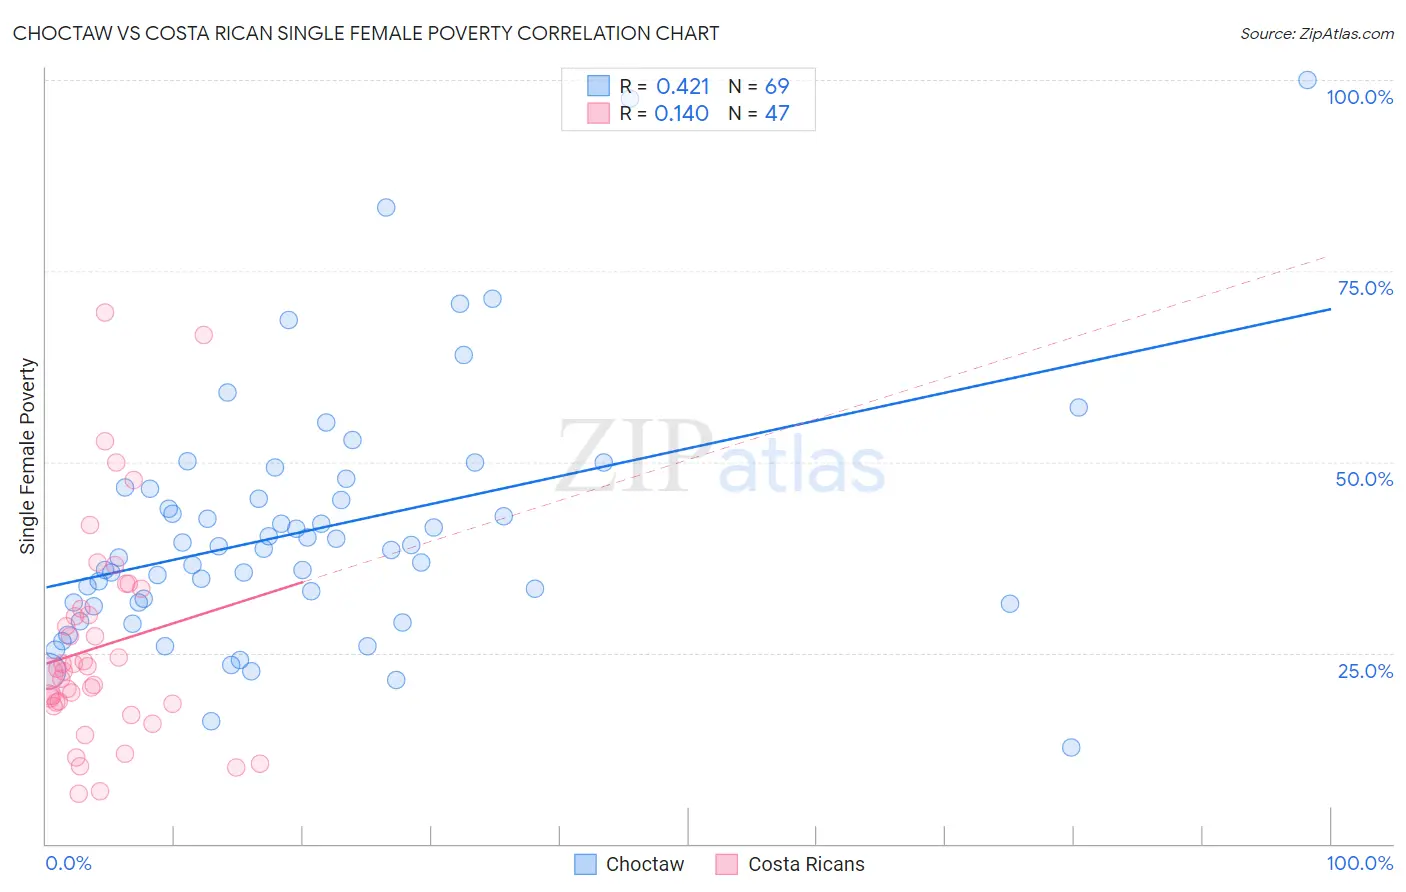
Choctaw vs Costa Rican Single Female Poverty Correlation Chart
The statistical analysis conducted on geographies consisting of 267,534,581 people shows a moderate positive correlation between the proportion of Choctaw and poverty level among single females in the United States with a correlation coefficient (R) of 0.421 and weighted average of 27.2%. Similarly, the statistical analysis conducted on geographies consisting of 251,572,949 people shows a poor positive correlation between the proportion of Costa Ricans and poverty level among single females in the United States with a correlation coefficient (R) of 0.140 and weighted average of 20.7%, a difference of 31.4%.
Single Female Poverty Correlation Summary
| Measurement | Choctaw | Costa Rican |
| Minimum | 12.6% | 6.5% |
| Maximum | 100.0% | 69.6% |
| Range | 87.4% | 63.1% |
| Mean | 41.2% | 25.8% |
| Median | 38.6% | 22.6% |
| Interquartile 25% (IQ1) | 31.5% | 18.4% |
| Interquartile 75% (IQ3) | 46.6% | 30.7% |
| Interquartile Range (IQR) | 15.1% | 12.3% |
| Standard Deviation (Sample) | 16.5% | 13.9% |
| Standard Deviation (Population) | 16.4% | 13.7% |
Similar Demographics by Single Female Poverty
Demographics Similar to Choctaw by Single Female Poverty
In terms of single female poverty, the demographic groups most similar to Choctaw are Creek (27.4%, a difference of 0.88%), Dutch West Indian (27.5%, a difference of 0.96%), Kiowa (26.9%, a difference of 0.98%), Chippewa (26.8%, a difference of 1.4%), and Seminole (26.8%, a difference of 1.5%).
| Demographics | Rating | Rank | Single Female Poverty |
| Chickasaw | 0.0 /100 | #318 | Tragic 26.3% |
| Blacks/African Americans | 0.0 /100 | #319 | Tragic 26.4% |
| Arapaho | 0.0 /100 | #320 | Tragic 26.4% |
| Yup'ik | 0.0 /100 | #321 | Tragic 26.6% |
| Seminole | 0.0 /100 | #322 | Tragic 26.8% |
| Chippewa | 0.0 /100 | #323 | Tragic 26.8% |
| Kiowa | 0.0 /100 | #324 | Tragic 26.9% |
| Choctaw | 0.0 /100 | #325 | Tragic 27.2% |
| Creek | 0.0 /100 | #326 | Tragic 27.4% |
| Dutch West Indians | 0.0 /100 | #327 | Tragic 27.5% |
| Apache | 0.0 /100 | #328 | Tragic 27.7% |
| Menominee | 0.0 /100 | #329 | Tragic 27.8% |
| Hopi | 0.0 /100 | #330 | Tragic 28.0% |
| Natives/Alaskans | 0.0 /100 | #331 | Tragic 28.2% |
| Yakama | 0.0 /100 | #332 | Tragic 28.3% |
Demographics Similar to Costa Ricans by Single Female Poverty
In terms of single female poverty, the demographic groups most similar to Costa Ricans are Arab (20.7%, a difference of 0.080%), Danish (20.7%, a difference of 0.090%), Immigrants from Oceania (20.7%, a difference of 0.20%), Kenyan (20.8%, a difference of 0.25%), and Northern European (20.8%, a difference of 0.26%).
| Demographics | Rating | Rank | Single Female Poverty |
| Immigrants | Uruguay | 77.7 /100 | #152 | Good 20.6% |
| Swedes | 77.1 /100 | #153 | Good 20.6% |
| Immigrants | Western Europe | 76.7 /100 | #154 | Good 20.6% |
| Samoans | 76.0 /100 | #155 | Good 20.6% |
| South American Indians | 75.7 /100 | #156 | Good 20.6% |
| Immigrants | Oceania | 74.3 /100 | #157 | Good 20.7% |
| Danes | 73.0 /100 | #158 | Good 20.7% |
| Costa Ricans | 71.8 /100 | #159 | Good 20.7% |
| Arabs | 70.8 /100 | #160 | Good 20.7% |
| Kenyans | 68.5 /100 | #161 | Good 20.8% |
| Northern Europeans | 68.4 /100 | #162 | Good 20.8% |
| Lebanese | 67.6 /100 | #163 | Good 20.8% |
| Iraqis | 64.5 /100 | #164 | Good 20.8% |
| Ugandans | 64.0 /100 | #165 | Good 20.8% |
| Norwegians | 63.0 /100 | #166 | Good 20.8% |