Choctaw vs Cypriot Single Female Poverty
COMPARE
Choctaw
Cypriot
Single Female Poverty
Single Female Poverty Comparison
Choctaw
Cypriots
27.2%
SINGLE FEMALE POVERTY
0.0/ 100
METRIC RATING
325th/ 347
METRIC RANK
19.2%
SINGLE FEMALE POVERTY
99.6/ 100
METRIC RATING
65th/ 347
METRIC RANK
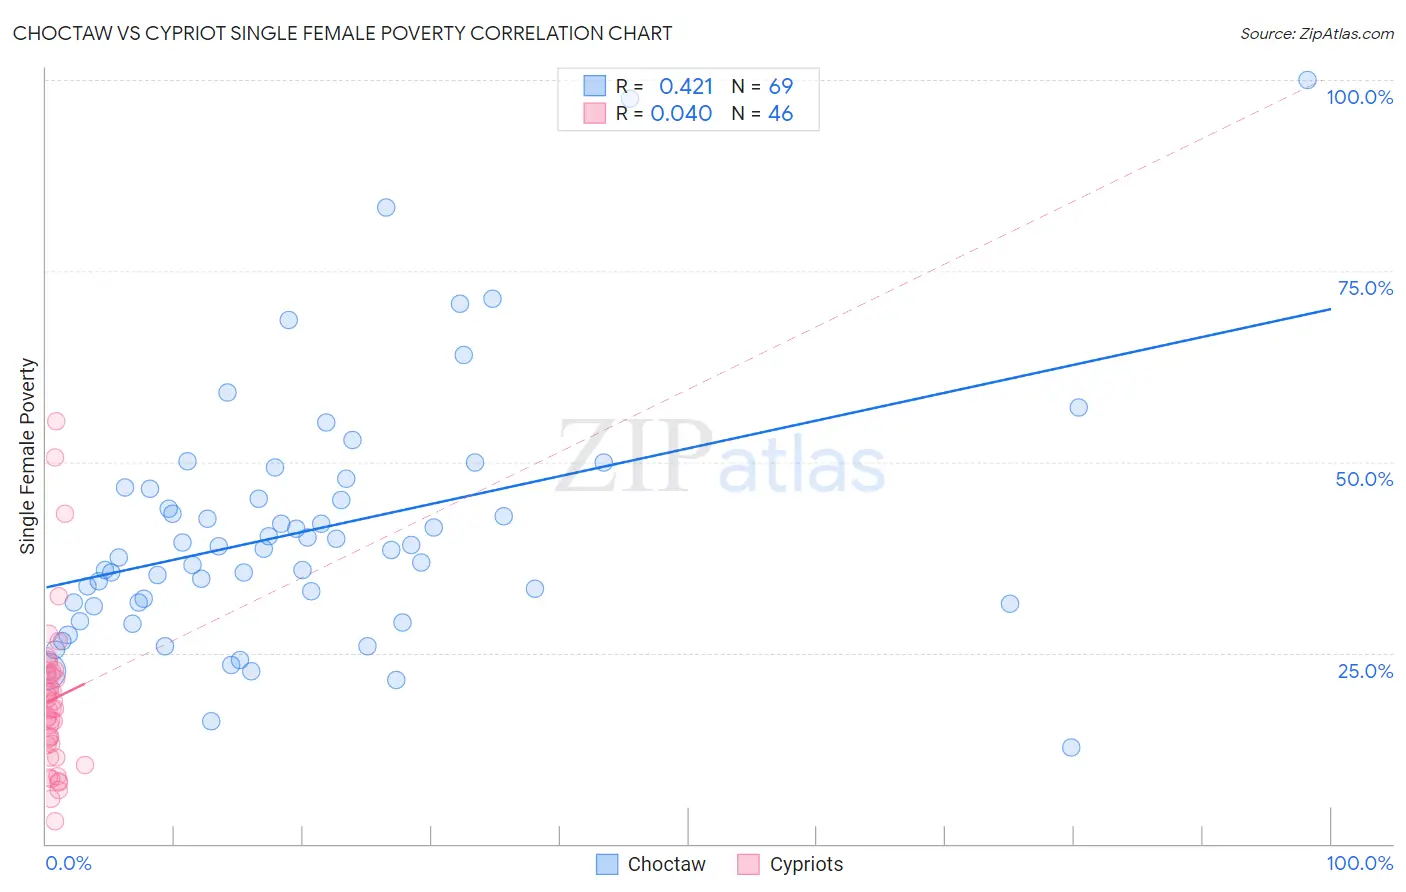
Choctaw vs Cypriot Single Female Poverty Correlation Chart
The statistical analysis conducted on geographies consisting of 267,534,581 people shows a moderate positive correlation between the proportion of Choctaw and poverty level among single females in the United States with a correlation coefficient (R) of 0.421 and weighted average of 27.2%. Similarly, the statistical analysis conducted on geographies consisting of 61,401,008 people shows no correlation between the proportion of Cypriots and poverty level among single females in the United States with a correlation coefficient (R) of 0.040 and weighted average of 19.2%, a difference of 41.4%.
Single Female Poverty Correlation Summary
| Measurement | Choctaw | Cypriot |
| Minimum | 12.6% | 2.9% |
| Maximum | 100.0% | 55.3% |
| Range | 87.4% | 52.4% |
| Mean | 41.2% | 18.9% |
| Median | 38.6% | 17.7% |
| Interquartile 25% (IQ1) | 31.5% | 13.0% |
| Interquartile 75% (IQ3) | 46.6% | 22.5% |
| Interquartile Range (IQR) | 15.1% | 9.5% |
| Standard Deviation (Sample) | 16.5% | 10.4% |
| Standard Deviation (Population) | 16.4% | 10.3% |
Similar Demographics by Single Female Poverty
Demographics Similar to Choctaw by Single Female Poverty
In terms of single female poverty, the demographic groups most similar to Choctaw are Creek (27.4%, a difference of 0.88%), Dutch West Indian (27.5%, a difference of 0.96%), Kiowa (26.9%, a difference of 0.98%), Chippewa (26.8%, a difference of 1.4%), and Seminole (26.8%, a difference of 1.5%).
| Demographics | Rating | Rank | Single Female Poverty |
| Chickasaw | 0.0 /100 | #318 | Tragic 26.3% |
| Blacks/African Americans | 0.0 /100 | #319 | Tragic 26.4% |
| Arapaho | 0.0 /100 | #320 | Tragic 26.4% |
| Yup'ik | 0.0 /100 | #321 | Tragic 26.6% |
| Seminole | 0.0 /100 | #322 | Tragic 26.8% |
| Chippewa | 0.0 /100 | #323 | Tragic 26.8% |
| Kiowa | 0.0 /100 | #324 | Tragic 26.9% |
| Choctaw | 0.0 /100 | #325 | Tragic 27.2% |
| Creek | 0.0 /100 | #326 | Tragic 27.4% |
| Dutch West Indians | 0.0 /100 | #327 | Tragic 27.5% |
| Apache | 0.0 /100 | #328 | Tragic 27.7% |
| Menominee | 0.0 /100 | #329 | Tragic 27.8% |
| Hopi | 0.0 /100 | #330 | Tragic 28.0% |
| Natives/Alaskans | 0.0 /100 | #331 | Tragic 28.2% |
| Yakama | 0.0 /100 | #332 | Tragic 28.3% |
Demographics Similar to Cypriots by Single Female Poverty
In terms of single female poverty, the demographic groups most similar to Cypriots are Palestinian (19.2%, a difference of 0.020%), Immigrants from Northern Europe (19.2%, a difference of 0.030%), Immigrants from Europe (19.2%, a difference of 0.030%), Immigrants from Egypt (19.2%, a difference of 0.060%), and Laotian (19.3%, a difference of 0.10%).
| Demographics | Rating | Rank | Single Female Poverty |
| Immigrants | Bulgaria | 99.7 /100 | #58 | Exceptional 19.1% |
| Sri Lankans | 99.6 /100 | #59 | Exceptional 19.2% |
| Russians | 99.6 /100 | #60 | Exceptional 19.2% |
| Cambodians | 99.6 /100 | #61 | Exceptional 19.2% |
| Lithuanians | 99.6 /100 | #62 | Exceptional 19.2% |
| Immigrants | Northern Europe | 99.6 /100 | #63 | Exceptional 19.2% |
| Immigrants | Europe | 99.6 /100 | #64 | Exceptional 19.2% |
| Cypriots | 99.6 /100 | #65 | Exceptional 19.2% |
| Palestinians | 99.6 /100 | #66 | Exceptional 19.2% |
| Immigrants | Egypt | 99.6 /100 | #67 | Exceptional 19.2% |
| Laotians | 99.5 /100 | #68 | Exceptional 19.3% |
| Paraguayans | 99.5 /100 | #69 | Exceptional 19.3% |
| Immigrants | Jordan | 99.4 /100 | #70 | Exceptional 19.3% |
| Immigrants | South Eastern Asia | 99.4 /100 | #71 | Exceptional 19.3% |
| Immigrants | Latvia | 99.4 /100 | #72 | Exceptional 19.3% |