Choctaw vs Immigrants from Nepal Single Female Poverty
COMPARE
Choctaw
Immigrants from Nepal
Single Female Poverty
Single Female Poverty Comparison
Choctaw
Immigrants from Nepal
27.2%
SINGLE FEMALE POVERTY
0.0/ 100
METRIC RATING
325th/ 347
METRIC RANK
20.3%
SINGLE FEMALE POVERTY
90.6/ 100
METRIC RATING
137th/ 347
METRIC RANK
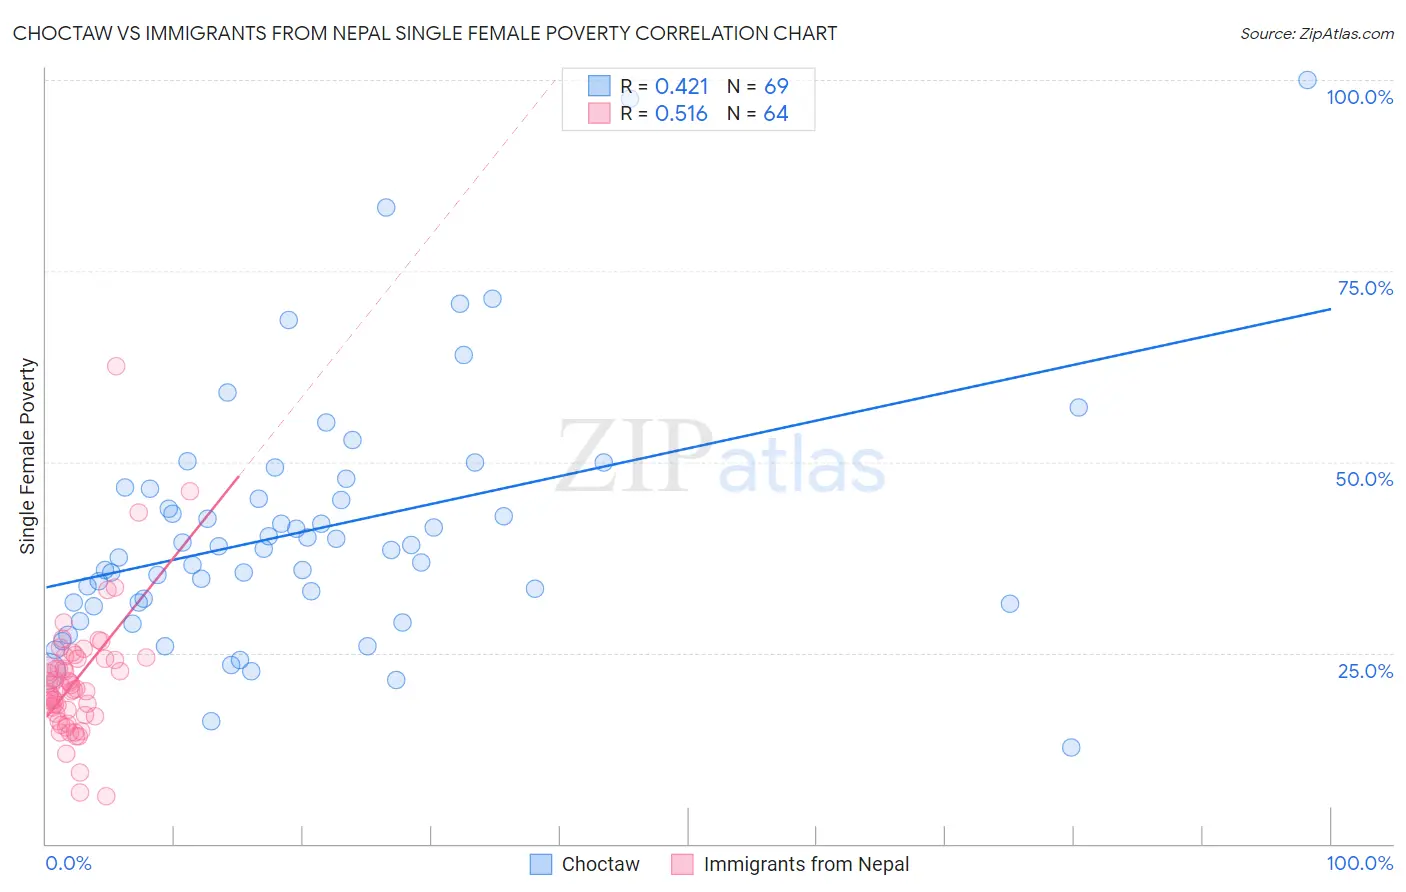
Choctaw vs Immigrants from Nepal Single Female Poverty Correlation Chart
The statistical analysis conducted on geographies consisting of 267,534,581 people shows a moderate positive correlation between the proportion of Choctaw and poverty level among single females in the United States with a correlation coefficient (R) of 0.421 and weighted average of 27.2%. Similarly, the statistical analysis conducted on geographies consisting of 185,480,601 people shows a substantial positive correlation between the proportion of Immigrants from Nepal and poverty level among single females in the United States with a correlation coefficient (R) of 0.516 and weighted average of 20.3%, a difference of 34.2%.
Single Female Poverty Correlation Summary
| Measurement | Choctaw | Immigrants from Nepal |
| Minimum | 12.6% | 6.3% |
| Maximum | 100.0% | 62.5% |
| Range | 87.4% | 56.2% |
| Mean | 41.2% | 21.5% |
| Median | 38.6% | 20.5% |
| Interquartile 25% (IQ1) | 31.5% | 17.0% |
| Interquartile 75% (IQ3) | 46.6% | 24.3% |
| Interquartile Range (IQR) | 15.1% | 7.3% |
| Standard Deviation (Sample) | 16.5% | 8.5% |
| Standard Deviation (Population) | 16.4% | 8.5% |
Similar Demographics by Single Female Poverty
Demographics Similar to Choctaw by Single Female Poverty
In terms of single female poverty, the demographic groups most similar to Choctaw are Creek (27.4%, a difference of 0.88%), Dutch West Indian (27.5%, a difference of 0.96%), Kiowa (26.9%, a difference of 0.98%), Chippewa (26.8%, a difference of 1.4%), and Seminole (26.8%, a difference of 1.5%).
| Demographics | Rating | Rank | Single Female Poverty |
| Chickasaw | 0.0 /100 | #318 | Tragic 26.3% |
| Blacks/African Americans | 0.0 /100 | #319 | Tragic 26.4% |
| Arapaho | 0.0 /100 | #320 | Tragic 26.4% |
| Yup'ik | 0.0 /100 | #321 | Tragic 26.6% |
| Seminole | 0.0 /100 | #322 | Tragic 26.8% |
| Chippewa | 0.0 /100 | #323 | Tragic 26.8% |
| Kiowa | 0.0 /100 | #324 | Tragic 26.9% |
| Choctaw | 0.0 /100 | #325 | Tragic 27.2% |
| Creek | 0.0 /100 | #326 | Tragic 27.4% |
| Dutch West Indians | 0.0 /100 | #327 | Tragic 27.5% |
| Apache | 0.0 /100 | #328 | Tragic 27.7% |
| Menominee | 0.0 /100 | #329 | Tragic 27.8% |
| Hopi | 0.0 /100 | #330 | Tragic 28.0% |
| Natives/Alaskans | 0.0 /100 | #331 | Tragic 28.2% |
| Yakama | 0.0 /100 | #332 | Tragic 28.3% |
Demographics Similar to Immigrants from Nepal by Single Female Poverty
In terms of single female poverty, the demographic groups most similar to Immigrants from Nepal are Slovene (20.3%, a difference of 0.030%), Immigrants from Kuwait (20.3%, a difference of 0.040%), Syrian (20.3%, a difference of 0.050%), Immigrants from Canada (20.2%, a difference of 0.11%), and Immigrants from Iraq (20.2%, a difference of 0.12%).
| Demographics | Rating | Rank | Single Female Poverty |
| Immigrants | Hungary | 92.3 /100 | #130 | Exceptional 20.2% |
| Pakistanis | 92.1 /100 | #131 | Exceptional 20.2% |
| Uruguayans | 92.1 /100 | #132 | Exceptional 20.2% |
| Immigrants | England | 91.9 /100 | #133 | Exceptional 20.2% |
| Immigrants | Venezuela | 91.5 /100 | #134 | Exceptional 20.2% |
| Immigrants | Iraq | 91.2 /100 | #135 | Exceptional 20.2% |
| Immigrants | Canada | 91.2 /100 | #136 | Exceptional 20.2% |
| Immigrants | Nepal | 90.6 /100 | #137 | Exceptional 20.3% |
| Slovenes | 90.5 /100 | #138 | Exceptional 20.3% |
| Immigrants | Kuwait | 90.4 /100 | #139 | Exceptional 20.3% |
| Syrians | 90.4 /100 | #140 | Exceptional 20.3% |
| Immigrants | North America | 89.5 /100 | #141 | Excellent 20.3% |
| Immigrants | Uganda | 89.1 /100 | #142 | Excellent 20.3% |
| Australians | 88.4 /100 | #143 | Excellent 20.3% |
| Immigrants | Uzbekistan | 88.3 /100 | #144 | Excellent 20.3% |